PLC Communication Troubleshooting: A Layer-by-Layer Method
Troubleshoot PLC communication faults by separating physical link, addressing, transport, cyclic connection, protocol response, data quality and control logic evidence.
Review status: Editorially reviewed against current NIST OT-security guidance, official Modbus, ODVA EtherNet/IP, PI/Siemens PROFINET, EtherCAT Technology Group/Beckhoff, OPC Foundation, Rockwell Automation and Wireshark documentation; the installed device manuals, approved network design, risk assessment, cybersecurity rules and controlled change procedure govern the actual system
Direct answer
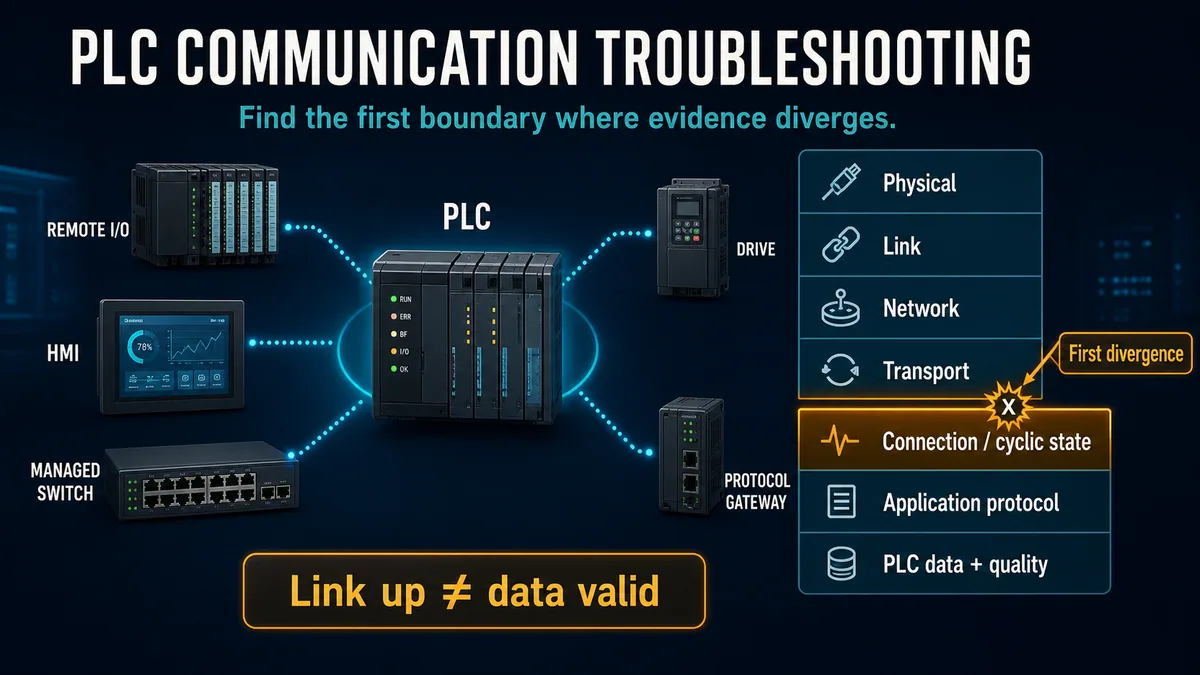
Troubleshoot a PLC communication fault by finding the first boundary where the expected state and observed evidence differ. Do not begin by replacing a cable, increasing every timeout or downloading a project. First classify the symptom, define one repeatable transaction or cyclic data relationship, preserve counters and configuration, and trace seven evidence layers: physical, link, network, transport, connection/cyclic state, application protocol, and PLC data/quality/logic.
A link light proves only the local link state described by that product. A successful ping proves only the tested IP path and ICMP behavior. Neither proves that an EtherNet/IP I/O connection is established, a PROFINET device matches the configured name, an EtherCAT datagram has the expected Working Counter, a Modbus server accepted a request, an OPC UA subscription is publishing fresh values, or the PLC is using the received data correctly.
For every layer, record three things: expected state, observed state, and source of the observation. Compare the same failing transaction with a known-good path where possible. Change one variable, repeat the same test, and retain rollback. The first divergent boundary identifies the next useful measurement without pretending that every fault proceeds from the bottom layer upward.
Establish the safety, process and change boundary
Preserve control behavior before touching communications
An industrial network carries more than diagnostic traffic. It may carry output commands, safety-related status, motion references, interlocks, recipes, alarms, historian data and remote access. Disconnecting a device, changing a switch, forcing a reconnect or downloading hardware configuration can change equipment behavior. Follow the plant risk assessment, lockout/tagout and electrical safety procedure, cybersecurity authorization, backup process and management-of-change rules.
Determine how the controller and field device behave when data becomes invalid, stale or unavailable. Do not assume “communications lost” means outputs de-energize, hold last state or enter a universally safe state. Those decisions are product- and application-specific and belong to the validated control design. Rockwell's current safety-controller documentation, for example, explicitly places responsibility on the designer to choose the data that initiates a shutdown; this guide cannot define that choice.
| Before-test question | Evidence to preserve | Why it matters |
|---|---|---|
| what process is the link controlling? | operating mode, equipment state, active work permits and critical interlocks | bounds the consequence of loss/reconnect |
| what happens on stale or bad data? | PLC logic, module connection behavior, quality handling and device fail state | prevents an unsafe assumption about communications loss |
| what changed recently? | project, firmware, managed-switch, firewall, device replacement and cable-work history | establishes a time-correlated hypothesis without proving causation |
| what is the approved baseline? | versioned PLC/HMI/device/switch/gateway configuration and network drawing | makes comparison and rollback possible |
| who may capture or alter traffic? | cybersecurity authorization and data-handling rules | packet captures can expose process and credential-related information |
| how will success be accepted? | defined transaction, load, duration, counter and recovery criteria | prevents “it worked once” from closing the incident |
Prefer a read-only and isolated proof
Use a simulator, test controller, spare device, maintenance mode, isolated test segment or documented read-only transaction when possible. Do not scan unknown ports, mirror production traffic, install an analyzer, move VLANs, reset diagnostic counters or disconnect redundant links without permission. NIST SP 800-82 Rev. 3 emphasizes that OT security decisions must account for unique performance, reliability and safety requirements; ordinary IT troubleshooting habits may be disruptive in an operating plant.
Document the rollback before the change. A configuration edit that appears harmless can alter device ownership, address assignment, update timing, redundancy, multicast behavior or firewall policy. Save the failing evidence before rebooting a controller, switch or gateway because a restart can erase logs and counters while temporarily masking the condition.
Classify the communication symptom precisely
Separate link, connection, quality and application outcomes
“PLC not communicating” is too broad to test. Identify which consumer reports the problem, which data relationship failed, when it began, whether the failure is continuous or intermittent, and which neighboring relationships remain healthy. Then choose the closest outcome class.
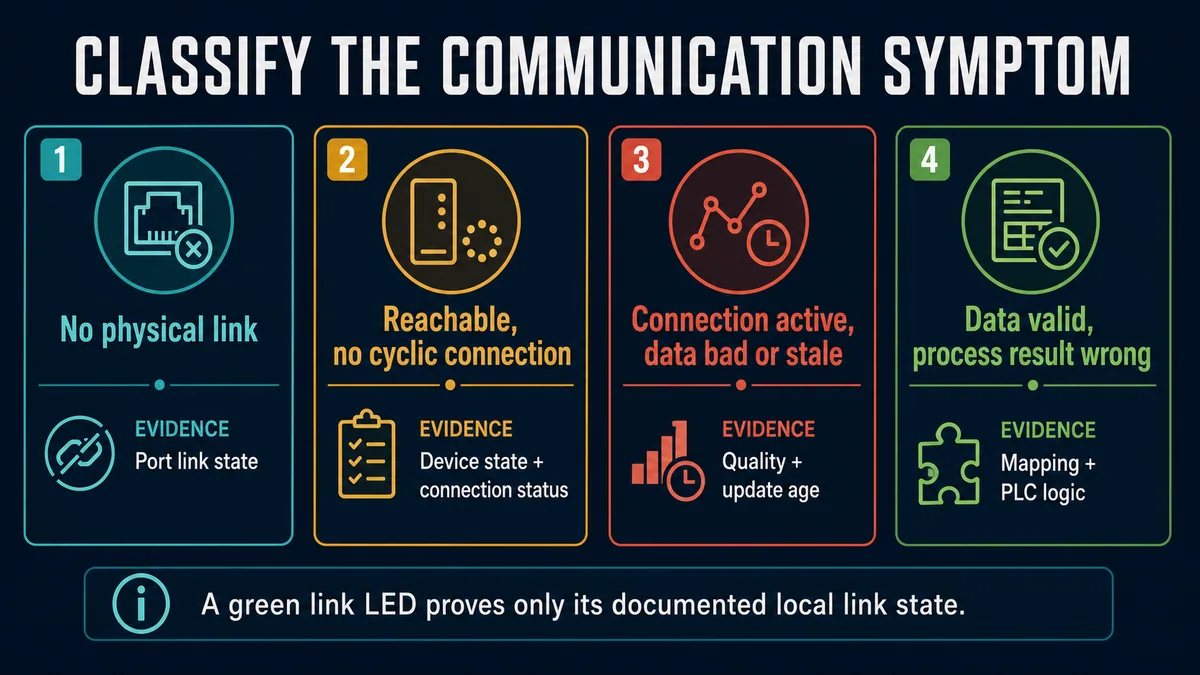
| Symptom class | What is actually observed | First decisive evidence | Common false shortcut |
|---|---|---|---|
| no physical link | documented port link state is down or unstable | both adjacent port states, power and link-transition timestamps | cable blamed without checking device/port power or administrative state |
| node unreachable | intended identity/path is not reachable by the chosen test | source interface, addressing/routing, duplicate identity and path evidence | ping failure equated with a dead PLC |
| reachable, no industrial connection | basic path works but cyclic/session relationship is absent or faulted | native module/device/connection state and fault code | ping success treated as proof the application works |
| connection active, data bad/stale | connection reports active but value quality, update age or sequence is invalid | quality/status, producer update, consumer watchdog and timestamp | last value displayed as fresh |
| protocol exception/rejection | peer returns a valid protocol error or refuses configuration | exact request/configuration and native error code | network rebuilt for an application-layer rejection |
| values plausible but wrong | data arrives yet mapping, type, scale, byte order or logic use is wrong | raw payload versus PLC tag and known input | transport blamed for deterministic interpretation error |
| intermittent loss | state/counter changes correlate with load, topology or environment | synchronized first-out events and counter deltas | reboot used before evidence is preserved |
Write a fault signature before testing
A useful fault signature might read: “Line 2 controller loses its EtherNet/IP input connection to drive VFD-204 for 100–300 ms during three recent motor starts; the controller remains in RUN, the switch link stays up, input quality faults, and the drive's output connection is unaffected.” That statement identifies participants, direction, duration, conditions and healthy comparisons.
Record exact controller and device identifiers, interface/port, protocol, direction, message or connection, data age/quality, timestamps, relevant machine state and the first status code. Avoid statements such as “network dropped” unless a specific boundary observed loss.
| Fault-signature field | Example form | Diagnostic value |
|---|---|---|
| consumer and producer | controller A consuming input assembly from device B | fixes direction and ownership |
| relationship | cyclic I/O, explicit message, Modbus poll, OPC UA subscription, engineering connection | prevents mixing unrelated traffic |
| failure state | timeout, connection fault, invalid Working Counter, bad quality, exception, stale value | selects native evidence |
| first timestamp/duration | source time, receive time and known clock offset | supports event ordering |
| scope | one node, one port, one VLAN, one protocol or whole controller | narrows shared boundaries |
| trigger/correlation | startup, high load, cabinet motion, firmware change or random | guides a controlled reproduction |
| healthy control | peer device, alternate client, other direction or known-good request | distinguishes shared from local boundaries |
Use a seven-layer evidence ladder
Treat the ladder as a diagnostic model, not a protocol map
The familiar OSI model helps organize evidence, but industrial protocols do not all map identically. EtherCAT process data normally operates directly in Ethernet frames rather than through IP and TCP. Modbus RTU uses a serial data-link framing model. EtherNet/IP uses CIP over Ethernet/IP transport mechanisms. PROFINET combines Ethernet services and real-time communication modes. OPC UA can use sessions, subscriptions and secure channels. The ladder below is therefore a practical evidence sequence, not a claim that every protocol implements every rung.
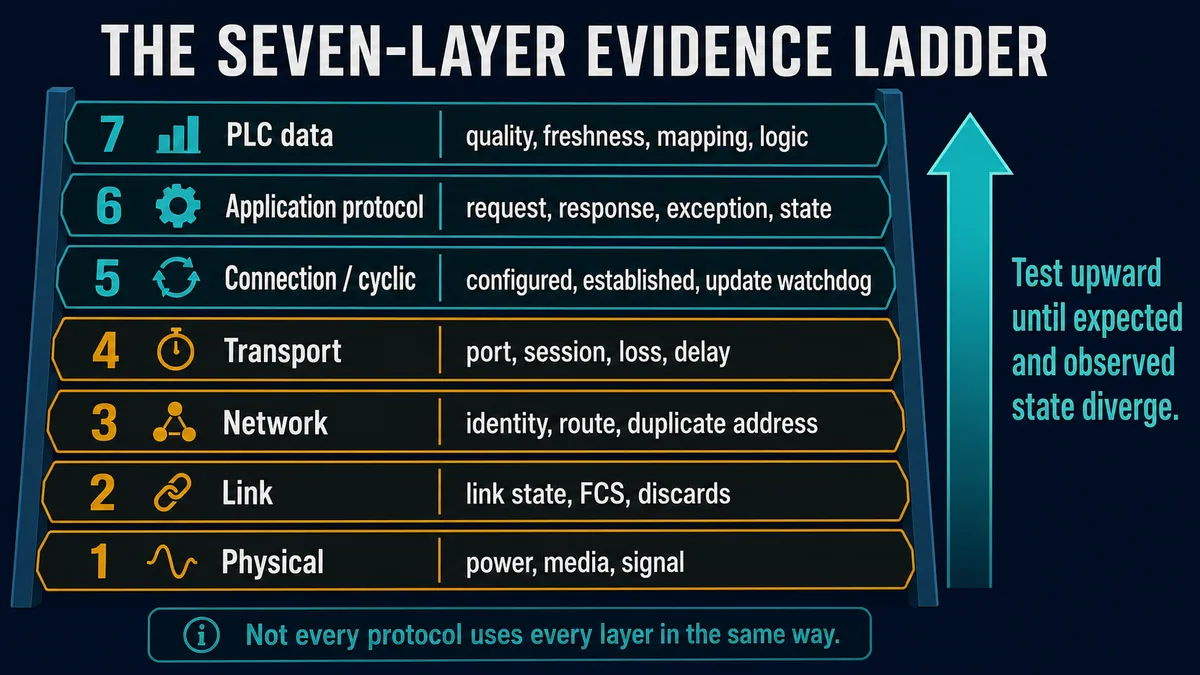
| Layer | Expected-state question | Strong evidence | Weak evidence alone |
|---|---|---|---|
| physical | are devices powered and is the specified medium/signalling available? | approved measurement, transceiver/device state and installed-media test | visual cable appearance |
| link | do adjacent ports form a stable link and accept frames? | both port states, negotiated parameters, FCS/discard/link counters | one green LED |
| network/identity | is the intended node uniquely identified and reachable through the designed path? | device identity, address/name, ARP/neighbor/routing/VLAN and duplicate detection | remembered IP address |
| transport | does the required port/session or datagram flow exist with acceptable loss/delay? | connection trace, listener/session state, retransmission/loss and timing | “Ethernet works” |
| connection/cyclic | did producer and consumer establish the configured industrial relationship and update watchdog? | native connection/module/device state, expected/actual participants and update evidence | ping response |
| application protocol | did the peer accept the request/configuration and return valid protocol state? | decoded request/response, exception/fault and server log | received byte count |
| PLC data/use | is data fresh, good quality, correctly mapped and used by logic? | raw payload, quality/age, tag mapping and logic trace | plausible HMI number |
Find the first divergence, not the loudest alarm
One physical interruption can create dozens of controller, HMI and historian alarms. The first visible alarm is not necessarily the first causal event because controller scans, connection watchdogs, network transport, server queues and HMI polling use different detection and timestamp locations. Align source and receive times where possible and document clock health and resolution.
Compare expected versus observed evidence across the same transaction. If link counters remain stable, the device identity is correct, the native cyclic connection is established and input quality is good, stop changing the switch. Continue into data mapping and logic. If the switch receive FCS counter increments exactly with the failed test while the upstream transmitter reports no local receive error, inspect that direction and boundary rather than the entire plant network.
Prove the physical and link state from both ends
Read adjacent port state and changes over time
Check device power, port administrative state, media type, transceiver/module compatibility and both adjacent link states using the installed manuals. Record negotiated speed and duplex where the technology negotiates them, but do not force settings simply because a legacy troubleshooting checklist says to. For serial networks, record mode, baud, parity, data bits, stop bits, addressing and interface standard. The detailed RS-485 wiring guide owns termination, bias, reference and topology practices.
Status indicators are product-specific. Rockwell's current ControlLogix EtherNet/IP indicator documentation distinguishes no IP/disabled, configured but no active connection, established active connection, duplicate/invalid configuration and link/activity states. Read the exact model manual rather than assigning a universal meaning to green, flashing green or red.
| Observation | What it can support | What it cannot prove |
|---|---|---|
| both adjacent links continuously up | local physical/link negotiation exists on both ports | correct VLAN, identity, cyclic connection or valid data |
| link transition count rises | link state changed during the interval | whether the cause is media, port, power or intentional reconfiguration |
| FCS error count rises at a receiver | that receiver accepted a frame with invalid Ethernet FCS | which physical component created corruption without further isolation |
| inbound discard rises | frames reached the interface but were discarded by that interface | exact discard reason unless a more specific counter/log exists |
| outbound discard rises | frames intended for transmission were discarded | whether queue, policy, resource or other reason applies without details |
| no interface-counter change | that counter did not observe the tested event | that no fault occurred elsewhere or the counter is supported/current |
Use counter deltas with direction and ownership
Rockwell port diagnostics expose interface counters such as inbound/outbound packets, discards and errors, plus media counters including alignment and FCS errors on supported controllers. Similar switch and device counters may exist, but names and semantics vary. Preserve lifetime totals and uptime, then measure the delta during a defined transaction count or interval.
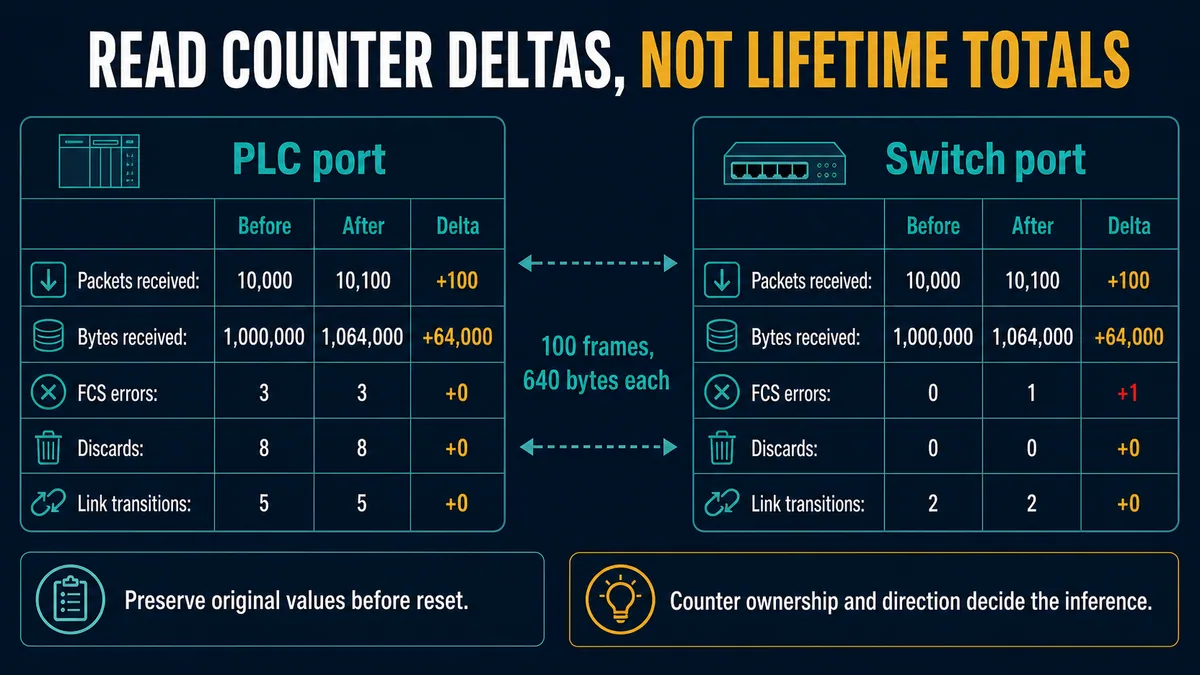
A lifetime FCS count of 20 may be old and irrelevant; a delta of one that aligns with every failed test is actionable. Do not reset counters before saving the baseline. Some controllers cannot display counters while offline or during a communication error, and some switches roll counters over. Record uptime, reset time, support state and collection timestamp.
Live mini-lab
Try it: press START, then STOP
A stop-dominant seal-in rung: START latches the motor output through its own contact, and STOP breaks the circuit.
Watch the output lamp: it stays on after START until you press STOP.
Free to start · runs in your browserOpens plcsimulationsoftware.com — same team
Prove identity, addressing and the intended path
Distinguish address, device name and configured identity
Industrial devices can be identified by IP and MAC address, PROFINET device name, EtherNet/IP identity and electronic keying, Modbus unit/slave address, EtherCAT configured topology/position, OPC UA endpoint/certificate identity or vendor route syntax. A replacement device can answer at the expected IP yet fail because its product identity, firmware compatibility, assembly size, device name, certificate or slot/path is wrong.
Build an endpoint table from the live devices and the approved configuration. Look for duplicates, unexpected fallback/default addresses, stale ARP/neighbor information, swapped ports, wrong controller project, duplicate serial addresses and gateway Unit Identifier mappings. Do not use active discovery on an OT network without authorization.
| Identity surface | Expected evidence | Failure pattern |
|---|---|---|
| Ethernet/IP node | unique IP/MAC plus correct subnet, route/VLAN and configured product identity | duplicate IP, wrong replacement model/keying or wrong chassis path |
| PROFINET IO device | configured device name, IP parameters, station/module identity and topology relationship | reachable IP but name mismatch or unexpected module/submodule |
| EtherCAT slave | expected position/topology, product identity, AL state and slave count | missing/unexpected slave or wrong transition state |
| Modbus RTU server | unique serial address and identical line settings | no response, wrong responder or collisions from duplicate address |
| Modbus TCP server/gateway | IP/port plus MBAP Unit Identifier mapping where used | TCP connection exists but downstream device route is wrong |
| OPC UA server | endpoint URL, security policy/mode, certificate trust and namespace/node identity | session rejected, wrong namespace index assumption or untrusted certificate |
Prove the path separately from the application
For routed Ethernet, record the source interface, subnet/prefix, default gateway, VLAN, switch ports, routed/firewall boundaries, network-address translation where approved, and destination listener. A successful ping shows that an ICMP exchange worked along the tested path. The industrial protocol may use different ports, multicast, real-time Ethernet frames, discovery behavior, connection limits or security rules.
For switched real-time networks, compare expected and actual topology using native engineering diagnostics. Siemens' current PROFINET with STEP 7 manual exposes controller diagnostic buffer, module information, communication data and expected/actual topology through engineering and web-server views. EtherCAT uses its own line/ring traversal and Working Counter/state evidence; an IP route test is not an EtherCAT process-data test.
Prove transport and connection or cyclic state
Separate socket/session reachability from industrial ownership
For TCP-based relationships, establish whether the correct destination port listens, whether the connection opens, whether it resets or closes, and whether requests and responses correlate. For UDP or raw Ethernet cyclic traffic, use the protocol's native connection and watchdog model rather than inventing a TCP session. Record connection limits, timeouts, requested update rates and producer/consumer direction.
A device may have an IP address and web page while no I/O connection is established. EtherNet/IP modules distinguish network presence from active connections. A PROFINET device can be discoverable but not in data exchange with its IO controller. An EtherCAT slave can be visible during scanning but remain outside OP state or return an unexpected Working Counter. An OPC UA TCP connection can exist while SecureChannel, Session or Subscription state has failed.
| Test result | What it establishes | Required next question |
|---|---|---|
| link up | local link exists | is intended identity/path correct? |
| node discovery/reachability succeeds | selected discovery or network test reached a node | is it the correct product and application endpoint? |
| TCP connection opens | listener and transport session exist | did secure/application session and request succeed? |
| native connection established | protocol accepted configured relationship | are updates timely, good quality and correctly consumed? |
| cyclic watchdog faults | expected updates were not accepted in time | did producer stop, path lose traffic, schedule overload or consumer reject data? |
| connection remains active | configured state machine still reports established | is data freshness/quality independently monitored? |
Measure update timing at the consumer
Capture requested/configured update interval, actual arrival distribution, watchdog or timeout, late/missed update counts and recovery behavior. A mean interval can hide bursts and tails. Compare normal load with the operating condition that triggers the fault. For EtherNet/IP, include Requested Packet Interval and connection timeout evidence defined by the product. For PROFINET, use configured update/watchdog diagnostics. For EtherCAT, inspect cycle, frame, Working Counter and lost-frame evidence rather than an IP round-trip.
Avoid increasing watchdogs until failures disappear. A longer deadline may reduce nuisance trips, but it can also lengthen stale-data exposure and hide capacity, scheduling or physical faults. The correct value comes from documented protocol/product behavior, measured worst-case timing and the process response requirement.
Read protocol-native evidence before translating symptoms
Use the field that the protocol actually defines
Protocol-specific diagnostics answer different questions. A Modbus exception is a valid application response, whereas an RTU CRC-invalid request is normally discarded and can produce timeout at the requester. An EtherCAT Working Counter represents successful datagram memory interactions by addressed slaves; it is not a Modbus CRC or a TCP retransmission count. EtherNet/IP electronic keying/assembly faults and PROFINET name/topology/module diagnostics have their own ownership.
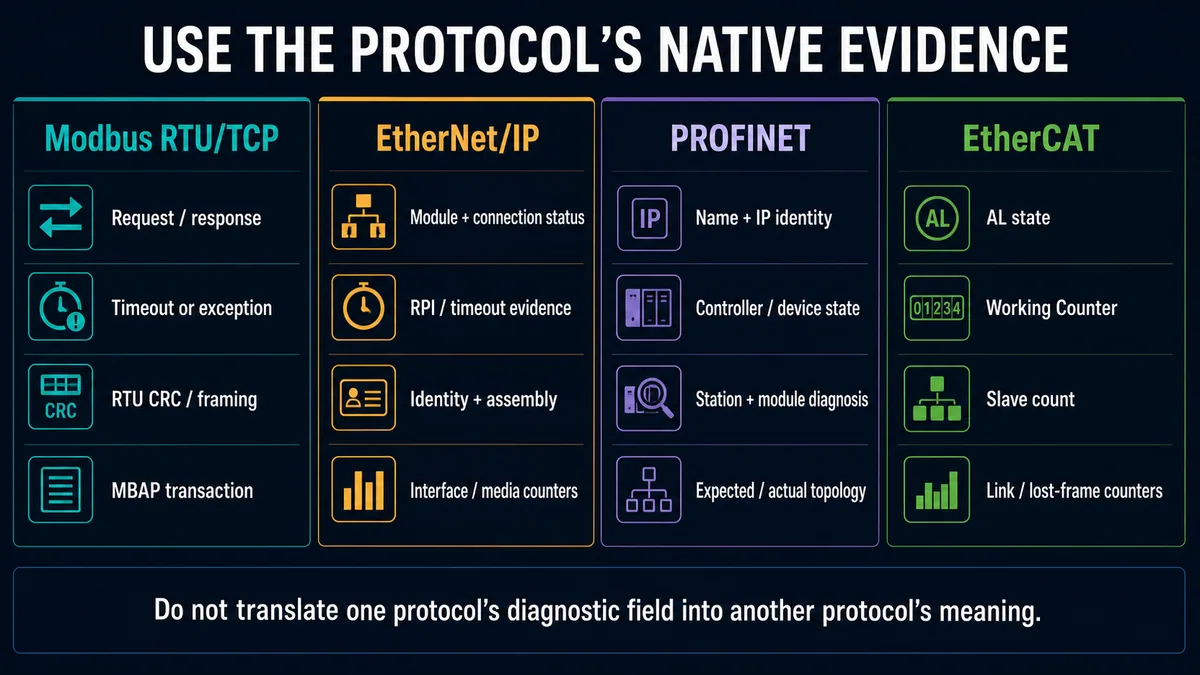
| Protocol | Native first-out evidence | Configuration identity | Specialist guide |
|---|---|---|---|
| Modbus RTU/TCP | request/reply, timeout, exception; RTU frame/CRC or TCP MBAP/connection evidence | serial address/settings or TCP endpoint/Unit Identifier/register request | Modbus timeout, CRC and no response |
| EtherNet/IP | module/connection state, extended fault, RPI/timeout and interface/media counters | product identity/keying, IP/path, connection type and assemblies | EtherNet/IP PLC guide |
| PROFINET | IO controller/device state, station/module diagnosis, alarms and expected/actual topology | device name, IP, GSDML/module/submodule configuration | PROFINET PLC guide |
| EtherCAT | AL state, expected Working Counter, slave count, link/lost-frame/CRC evidence | configured topology, slave identity and process-data mapping | EtherCAT PLC guide; Beckhoff/TwinCAT setup and diagnostics |
| CANopen | NMT state, heartbeat/node guarding, EMCY, SDO abort and bus/controller errors | node ID, bitrate, object dictionary and PDO mapping | CANopen PLC guide |
| OPC UA | SecureChannel/Session/Subscription state, StatusCode, sequence/keepalive and DataValue quality/timestamps | endpoint, security/trust, namespace/node and monitored-item settings | product and OPC UA specification documentation |
Preserve exact error codes and state transitions
Do not paraphrase connection timed out, configuration mismatch, bad quality, SAFE-OP, station failure, illegal data address and FCS error as “communication error.” Record the raw code, hexadecimal value where provided, component, timestamp, state before/after and configuration version. Search the manual for that product and firmware.
The same phrase can have different scope across products. “Timeout” might mean a TCP connect timer, explicit-message reply timer, cyclic I/O watchdog, gateway downstream timer, HMI tag-quality timeout or application watchdog. Name the timer owner and the event it expected.
Validate application data, quality and PLC use
Track the payload into the consumer tag
Once the protocol relationship is healthy, compare raw received data with module/device input data, mapped controller tag, engineering conversion and logic consumer. Verify byte and word order, signedness, data type, scaling, units, status/quality bits, produced/consumed sizes and array offsets. A value can be syntactically valid yet semantically wrong.
Trace one known test condition. If an approved simulator or field source produces a documented value, record the raw payload, module data, mapped tag and HMI display at the same time. Do not force a dangerous process value to test communications. Use the PLC analog I/O signals guide for raw-to-engineering scaling and quality boundaries.
| Data boundary | Expected evidence | Frequent defect |
|---|---|---|
| producer/source | documented value, state and update time | source stopped updating while connection stays present |
| protocol payload | bytes/fields and protocol quality/status | wrong assembly/register/node or truncated mapping |
| module/driver buffer | accepted update, status and timestamp/sequence | connection active but buffer stale or faulted |
| PLC tag mapping | exact offset, type, length and copy logic | off-by-one address, size mismatch or stale copy |
| engineering conversion | scale, units, word/byte order and invalid handling | plausible but incorrect value |
| control logic consumer | enable/permissive, mode, latch and fallback behavior | valid tag ignored or stale tag retained |
| HMI/historian | source/receive time, quality and refresh/logging | last good value rendered as current |
Make freshness explicit
Every consequential consumer should have a documented way to distinguish current valid data from last-known data. Depending on platform, that may include protocol quality/status, connection state, heartbeat/sequence, source timestamp, consumer watchdog and update age. OPC UA DataValue carries status and source/server timestamps where supplied; the display and historian must preserve those semantics rather than silently flattening them into a number.
On recovery, decide whether the application accepts the first new value immediately, requires plausibility/range confirmation, reinitializes sequence state or demands operator confirmation. Communications recovery must not automatically restart equipment unless that behavior is intentionally designed and validated.
Capture traffic at the boundary that answers the question
Name the observation point and its blind spots
A client-side capture shows what the client capture stack presented at that interface. A switch mirror or approved tap shows traffic selected at that network boundary according to its configuration and capacity. A gateway downstream log/capture shows what entered the translated segment. No one point proves every hop.
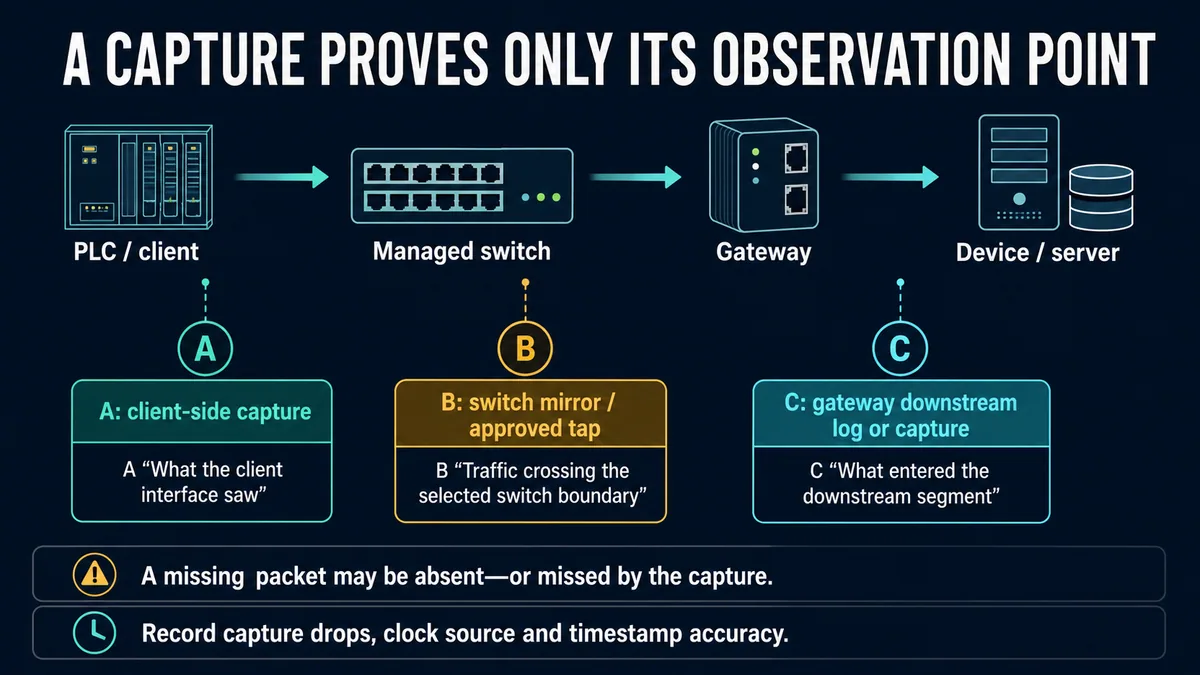
Wireshark documents that capture timestamps come through the capture library and operating-system/kernel path; timestamp precision is not the same as accuracy, and USB adapters can be poor sources when precise timing matters. Capture buffers can also drop traffic. Record interface, capture method, clock source/synchronization, timestamp resolution/accuracy, capture-drop statistics, filter, direction and topology.
| Capture goal | Suitable observation | Required caveat |
|---|---|---|
| did client emit the request? | client interface or adjacent approved boundary | application “sent” log may precede actual transmission |
| did traffic cross a switch boundary? | correctly configured mirror/tap at selected ports/VLANs | mirror oversubscription or configuration can omit traffic |
| did server receive/process it? | server log/counter or server-side capture | a frame reaching the NIC does not prove application acceptance |
| did gateway forward downstream? | gateway downstream counter/log/capture | upstream request alone cannot prove translation/serial delivery |
| is update timing within requirement? | observation with validated timestamp accuracy | display precision does not guarantee timing accuracy |
| is a packet truly absent? | correlated captures/counters at both sides | the capture itself may have dropped it |
Filter after preserving enough context
Capture only the authorized scope and duration, but retain enough context for identity, connection establishment and failure/recovery. A display filter can hide packets without removing them from the capture; a capture filter prevents acquisition. Preserve original files, hashes and notes under site policy. Sanitize sensitive OT addressing, process values and credentials before sharing.
Packet “expert” warnings are analysis hints, not root-cause verdicts. TCP retransmission seen at one observation point may reflect loss elsewhere, reordering, capture omission or endpoint behavior. Correlate with endpoint and switch counters and the industrial connection state.
Diagnose intermittent faults under load and change
Correlate the first state change with operating context
Collect a synchronized timeline of controller diagnostic buffer, device state, managed-switch counters/events, gateway logs, HMI quality, application alarms and process state. Record network and controller load, connection counts, message rate, multicast/broadcast rate, retries, queue/discard counters and task/cycle overrun evidence. Compare the failing interval with a healthy interval of the same operating mode.
Intermittent faults often expose marginal timing or capacity, but correlation is not proof. A motor start occurring near a fault could indicate physical interference, shared supply disturbance, controller load, sequence behavior or coincidence. Change one controlled variable and require repeatability before naming the cause.
| Intermittent pattern | Evidence-led hypotheses | Controlled comparison |
|---|---|---|
| fails at high poll/message rate | queue/resource limit, timeout, scheduling or retry amplification | one client/request rate versus production rate with counters |
| fails during device startup | address/name assignment, inrush/power, state transition or connection race | preserve boot and first-connection timeline |
| one direction fails | receive path, producer state, multicast/route or consumer configuration | directional counters/captures and known-good peer |
| fails after replacement | identity/keying, device name, firmware, assembly/module mismatch | expected versus actual identity/configuration export |
| all nodes behind gateway fail | shared upstream/downstream/gateway state or capacity | gateway both-side counters and direct approved baseline |
| data freezes but connection remains | source update, buffer/copy logic, quality or heartbeat defect | raw producer value versus payload/tag update age |
| link transitions with cabinet motion | connector/media/mechanical or device power issue | de-energized inspection and approved media test |
Treat unauthorized or unexplained change as a security signal
Duplicate addresses, unexpected devices, new services, route/firewall changes, unknown firmware/configuration edits and unusual scanning may be mistakes or security events. Preserve evidence and escalate through the site's OT incident process. Do not “fix” an unknown device by assigning it a new address or disabling a firewall rule before ownership and authorization are established.
NIST guidance supports asset awareness, network monitoring, change control and segmentation while accounting for OT safety and availability. Troubleshooting should improve that evidence trail, not create unmanaged laptops, taps, software or credentials in the control zone.
Run a controlled recovery and commissioning matrix
Prove normal, degraded and recovery behavior
After correcting the demonstrated cause, repeat the defined transaction or cyclic relationship under normal and peak credible load. Confirm identity, connection state, response/update distribution, error-counter deltas, data quality/freshness and control behavior. Test loss and recovery only through approved simulation or procedure; do not pull a production cable to satisfy a checklist.
| Commissioning case | Evidence to capture | Acceptance question |
|---|---|---|
| cold start in correct order | boot, identity, connection and first valid update timeline | does every participant reach the intended state without manual repair? |
| alternate start order | retry/backoff and eventual ownership state | is recovery deterministic and bounded? |
| normal cyclic load | update distribution, watchdog margin and zero/unexplained error deltas | is fresh good-quality data sustained? |
| peak approved message load | queue/discard/retry and task/cycle evidence | does diagnostic/explicit traffic coexist with cyclic control? |
| simulated source bad quality | consumer quality, stale timeout, alarm and fallback | is last-good data visibly distinguished? |
| approved connection interruption | native fault state and bounded detection | does control enter the validated degraded state? |
| reconnection | identity revalidation, new data acceptance and latched fault handling | can recovery create unexpected motion or stale replay? |
| configuration backup restore | hashes/versions and accepted communications | can the known-good baseline be reproduced? |
| monitoring handoff | dashboards/counters, ownership and alert thresholds | will recurrence preserve first-out evidence? |
Close the incident at the deepest proven layer
Write “Switch port 12 receive FCS counter increased on each failed transaction; approved media test found pair damage between cabinet A and junction B; replacement removed the delta across 10,000 representative updates” rather than “bad network cable.” Or write “PROFINET device was reachable at the expected IP but configured name differed from the controller project after replacement; assigning the approved name restored data exchange.”
Attach the before/after configuration, exact status codes, counter deltas, captures, versions, topology and acceptance results. Update drawings, port descriptions, spares procedure, monitoring and change record. If the evidence only proves correlation, state that limitation and keep monitoring.
Troubleshooting sequence by observed symptom
Follow the shortest decisive branch
| Observed symptom | First test | Second test | Branch owner |
|---|---|---|---|
| no port link | compare both adjacent documented port/power states | approved media/transceiver/port substitution or test | physical/link |
| ping fails but link up | verify source interface, intended IP/name, duplicate and route/VLAN | native discovery/device diagnostics | identity/network |
| ping works, PLC module faulted | read native module/connection fault and actual identity | compare configured keying/path/assemblies/timing | connection/configuration |
| remote I/O connects then drops | preserve first state/counter changes and update timing | compare load, producer state and path counters | cyclic/timing/link |
| HMI tag bad while PLC I/O good | trace HMI/OPC endpoint, quality, node/tag and subscription/poll | compare raw PLC tag and source/server timestamps | application/data |
| values freeze without fault | measure source update and consumer age/heartbeat | inspect buffer/copy/quality handling | data freshness/logic |
| one request gets an exception | preserve exact request and exception/fault | verify function/service/address/state/permissions | application protocol |
| all devices behind gateway fail | compare gateway upstream and downstream state/counters | direct approved downstream request or capture | gateway/shared path |
| failures only after device replacement | compare product identity, firmware, name/address and data layout | validate project/device configuration match | identity/configuration |
| intermittent FCS/discard delta | locate receiving interface and direction | correlate with link/power/load/environment then isolate | link/physical/resource |
Diagnostic answer map for PLC communication troubleshooting
| Question a technician or AI assistant may ask | Short, extractable answer | Evidence that decides it |
|---|---|---|
| Why is the PLC not communicating? | Classify whether link, identity/path, transport, cyclic connection, protocol response, data quality or PLC use first diverges. | expected/observed/source matrix for one transaction |
| Does a green Ethernet light prove PLC communications? | No. It proves only the product's documented local link state, not identity, connection or valid data. | adjacent port state plus native connection/data evidence |
| If ping works, is EtherNet/IP or PROFINET working? | No. Ping proves an ICMP path; the industrial connection, configuration and data exchange require native evidence. | module/device/connection state and cyclic updates |
| Which port counter matters most? | The counter that changes at the relevant receiving/transmitting interface during the controlled failure. | owner, direction, baseline, delta and test timestamps |
| Where should I capture PLC traffic? | At the boundary that can answer the next unresolved question, with documented blind spots and capture-drop/timestamp quality. | topology and observation-point comparison |
| Why does communication fail only under load? | Queue/resource limits, scheduling, response tails, retries or physical errors may emerge; measure rather than assume. | load, timing distribution, queues/discards and native connection events |
| Can a connection be active while data is stale? | Yes. Monitor quality, update age, heartbeat/sequence or source timestamps independently of connection state. | producer update and consumer freshness evidence |
| What proves a PLC communication repair? | The original fault signature no longer occurs across representative load while native states, counter deltas, quality and recovery meet acceptance criteria. | before/after repeatable commissioning record |
Continue with the exact network owner
Use Allen-Bradley IO-Link setup and diagnostics for master/device mapping, EtherCAT versus Ethernet for frame and topology differences, RS-485 twisted-pair cable guidance for the serial physical layer, and MQTT Sparkplug PLC integration for stateful publish/subscribe behavior. For controller-specific industrial Ethernet roles, use Allen-Bradley EtherNet/IP or the Rockwell PROFINET connectivity guide. Return here when the main problem is locating the failed layer rather than configuring one technology.
Frequently asked questions
What is the first step in PLC communication troubleshooting?
Define one precise failing relationship and preserve evidence. Record participants, direction, protocol, expected data or transaction, exact failure state, timestamps, configuration and healthy comparisons. Then classify the symptom before changing cables, addresses, timeouts or projects.
Why is my PLC online but remote I/O not communicating?
The engineering connection to the controller and the controller's cyclic I/O relationship are separate. Read the remote module/device connection state and fault, verify actual identity, configured path/name, assemblies or modules, update/watchdog settings and data quality. Ping or controller-online status cannot prove the I/O connection.
Does a successful ping mean the PLC network is healthy?
No. It proves that an ICMP exchange succeeded through the tested IP path. It does not prove the correct industrial endpoint, TCP/UDP port, security session, cyclic ownership, real-time Ethernet data, protocol configuration, update timing or application data quality.
What do FCS errors on a PLC or switch port mean?
They mean the receiving interface counted Ethernet frames that failed its frame-check sequence according to that product. Record which port received them, traffic direction and delta during a controlled interval. Further isolation is required before naming cable, connector, transceiver, port or interference as the cause.
How do I troubleshoot intermittent PLC network dropouts?
Preserve synchronized controller, device, switch and gateway events; record connection state, update timing, quality, link/FCS/discard counters, load and process context. Compare a failing interval with the same healthy operating mode, then change one variable and require repeatability.
Where should I capture industrial Ethernet packets?
At the approved observation point that resolves the next boundary: client side to prove client-interface traffic, a correctly configured switch mirror/tap to inspect a selected switch boundary, or server/gateway side to prove arrival or translation. Record blind spots, dropped captures and timestamp accuracy.
Should I increase a PLC communication timeout?
Only when measured valid worst-case response/update behavior exceeds a deadline that is demonstrably the first divergence and the longer detection time satisfies the process requirement. Do not use a longer timeout to hide FCS errors, wrong identity, overload, invalid configuration or a stopped producer.
Why are PLC values wrong when communication status is good?
The payload may be mapped or interpreted incorrectly. Compare raw protocol data with module/driver data, PLC tag offset/type/length, word and byte order, scale/units, quality and logic use. A valid connection establishes transport/configuration state, not semantic correctness.
How do I know whether a PLC communication fault is wiring or software?
Do not choose between those categories first. Locate the first divergent evidence layer. Link transitions, receiver FCS errors or serial framing counters direct physical/link tests; valid protocol rejection, identity mismatch, mapping or logic evidence directs configuration/application tests.
What should a PLC communication troubleshooting report include?
Include the fault signature, safety/change boundary, topology and participants, configuration/firmware versions, expected-versus-observed matrix, exact codes, counter baselines/deltas, captures and observation points, changes/rollback, commissioning cases, proven cause or stated uncertainty, and prevention/monitoring action.
Sources, review scope, and limitations
This guide combines a cross-protocol diagnostic method with official protocol, product, capture and OT-security evidence. It does not replace licensed standards, installed-product manuals, approved architecture, electrical/media certification, cybersecurity authorization, functional-safety validation or plant change control.
- NIST SP 800-82 Rev. 3: Guide to Operational Technology Security — current final NIST guidance on OT safety, reliability, architecture, monitoring, security and risk-management context.
- Rockwell Automation ControlLogix 5590 Port Diagnostics — interface/media counter definitions, support state and counter reset behavior.
- Rockwell Automation EtherNet/IP Status Indicators — documented distinction among IP configuration, active connections, duplicate configuration and link/activity states.
- Rockwell Automation ControlLogix Troubleshooting — module, controller, port, time-sync and communication-loss diagnostic surfaces.
- ODVA EtherNet/IP Technology Overview, PUB00138R8 — official current overview of CIP on Ethernet technology.
- ODVA EtherNet/IP Media Planning and Installation Manual — official media planning, verification and troubleshooting scope.
- Siemens PROFINET with STEP 7 Function Manual, 11/2025 — current diagnostics, controller buffer, communication information, module state and expected/actual topology surfaces.
- PI Diagnosis for PROFINET Guideline — official PI scope for device, PLC, engineering, HMI and maintenance diagnosis information.
- EtherCAT Technology Group: Diagnosis for Users — Working Counter, cyclic, hardware/software diagnostics and example procedures.
- Beckhoff EtherCAT System: Default Settings and Information — DevState, frame Working Counter state, slave processing and follow-up diagnostic behavior.
- Modbus Organization Specifications and Implementation Guides — official application, serial-line and TCP protocol documents.
- OPC UA Part 4: DataValue — data value, status and source/server timestamp semantics.
- Wireshark User's Guide: Time Stamps — timestamp source, precision versus accuracy and USB-adapter timing caveats.
- Wireshark User's Guide: Capture Files and File Modes — capture buffering, output files and long-duration capture considerations.
Now run it · free to start
Learn a repeatable way to find the fault
Split a stopped machine into input, logic, output and physical response, and take the measurement that proves each stage. Practised on simulated machines. Free to start.
Ownership disclosure: PLC Programming IO and PLC Simulation Software are operated by the same publisher.
PLC Programming IO Editorial Team
Industrial automation education, references, and software testing
The PLC Programming IO Editorial Team publishes sourced industrial-automation education and documents how material is reviewed, tested, and corrected. A team byline means the publisher is responsible for the page; it does not represent a fictional person or imply an engineering licence.
Coverage:
- • PLC programming concepts and examples
- • Vendor software tutorials and comparisons
- • SCADA, HMI, protocols, and instrumentation
- • Training, careers, and reference material
Review standard:
- • Prefer primary and official sources
- • Record software versions when material
- • Separate tested facts from estimates
- • Publish material corrections
Important scope note
This site provides education, not project-specific engineering approval. Safety, code, and compliance decisions require a qualified person with access to the actual machine and jurisdiction.