Siemens PLC Diagnostics: S7-1200/1500 Fault Guide
Diagnose Siemens S7-1200 and S7-1500 faults from CPU state, TIA Portal diagnostics, device and channel evidence, online/offline comparison, traces and controlled recovery.
Siemens PLC diagnostic first response
Go online with the CPU in TIA Portal, open Online & diagnostics → Diagnostics → Diagnostic buffer, and read the newest fault event before the resulting mode-change event. Then open the affected module in Online device view and compare its channel diagnostics, order number and firmware with the offline hardware configuration.
The front-panel LEDs identify the fault category; they are not a substitute for the diagnostic event. Siemens event IDs, local data and available diagnostic instructions vary by CPU family, firmware, module and TIA Portal version. A hexadecimal value copied from a different S7 model is therefore not a universal Siemens error-code lookup.
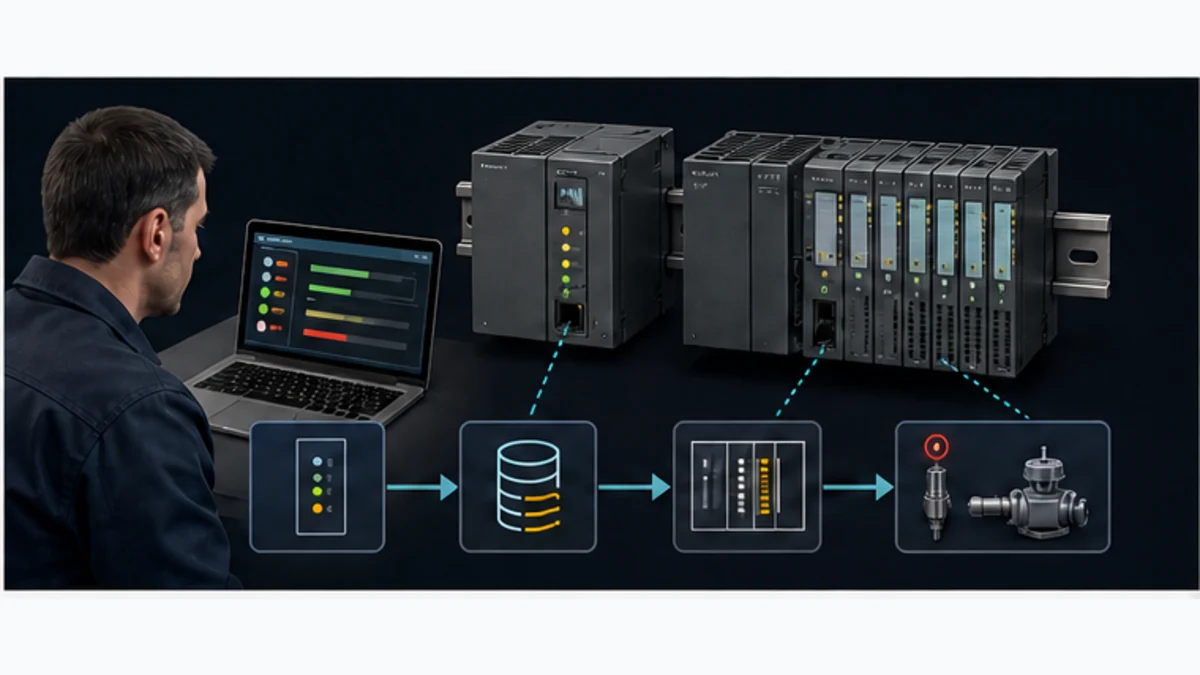
This guide covers S7-1200 and S7-1500 diagnostics in current TIA Portal projects, with notes for legacy S7-300/400 systems. It intentionally avoids presenting invented “universal” hexadecimal mappings. For the exact event format and response of your hardware, use the manual linked from the device’s Siemens Industry Online Support page.
This page is the canonical owner for Siemens PLC diagnostics, diagnosis, troubleshooting, error-code and fault-code intent. The general PLC troubleshooting guide owns the vendor-neutral incident method; the S7-1200 PROFINET guide owns device-name, module and cyclic-network commissioning; and the Siemens programming guide owns project creation and code structure. Those pages should link here when the task becomes a live Siemens CPU, TIA Portal or SIMATIC hardware diagnosis.
Match the symptom to the first useful Siemens evidence
| Observed symptom | First Siemens evidence | Do not start with |
|---|---|---|
| CPU is in STOP | diagnostic-buffer event immediately before the STOP transition | switching to RUN repeatedly |
| red ERROR LED | current and stored CPU/device diagnostics plus exact LED table | ordering a replacement CPU from the LED alone |
| module has a red marker | Online device view, channel detail, hardware ID and field/load supply | forcing the application tag |
| machine will not start while CPU is RUN | request, equipment state, permissives, command, mapped output and feedback | downloading a speculative logic change |
| PROFINET station unavailable | configured-versus-actual identity, device name, module layout and controller diagnostics | ping alone or assigning a random IP |
| intermittent stop or dropout | synchronized diagnostic events, trace, port-counter deltas and control-power evidence | clearing history after every trip |
| download is rejected | first compile/download diagnostic, target identity, access rights and version compatibility | disabling security controls |
| analog value is implausible | configured range, terminal measurement, raw value, quality and scaling | changing the engineering range to fit one bad reading |
Diagnosis means separating cause from consequence
Integrated system diagnostics can report CPU, module, channel and network events without an application programmer inventing a separate code for every condition. Application diagnostics add the process meaning that the controller cannot infer: “filling valve failed to open,” “conveyor feedback exceeded 2 seconds,” or “recipe version rejected.” A complete incident record uses both layers.
A hardware event may be the cause, an I/O access event the technical consequence, and a motor-feedback alarm the process consequence. The technician should preserve all three but repair the earliest proved divergence. Conversely, a process alarm can occur with no hardware event because the PLC command and channel are correct while an actuator, protection device, pneumatic supply or mechanical element failed. TIA Portal is then a boundary-finding tool, not a universal repair console.
| Diagnostic layer | What it can prove | What it cannot prove alone |
|---|---|---|
| CPU/firmware | mode, events, resource and internal diagnostic context | that every external module and field device is healthy |
| configured hardware | expected order, slots, parameters, addresses and network relationships | that installed wiring or replacement hardware matches |
| online device/channel | actual status, identity and available module diagnostics | the physical process cause beyond the channel |
| application state | request, permissive, interlock, command, timeout and alarm logic | actual voltage, motion, pressure or mechanical integrity |
| field measurement | physical power, signal and feedback at a defined point | whether the program interpreted that point correctly |
| synchronized trace/history | ordering and timing across selected variables/events | a cause that was never captured or was overwritten before collection |
Fast diagnostic workflow
- Make the process safe. Stop automatic motion or heat through the designed operating procedure. Do not use a programming laptop as the only protective measure.
- Record the state before resetting anything. Photograph the CPU and module LEDs; record the CPU mode, timestamp, operator report and last successful cycle.
- Go online without downloading. Confirm that TIA Portal has reached the intended CPU by checking order number, serial number and online device name.
- Read the diagnostic buffer newest-first. Find the first causal event, not merely “CPU changed to STOP.”
- Open Online device view. A red device or channel marker often narrows the fault to a module, port or configured channel.
- Compare online and offline configurations. Check order numbers, module positions, IP/device names, firmware and parameterization.
- Correct one root cause. Repair power, wiring, addressing, configuration or code. Avoid clearing multiple symptoms at once.
- Verify under controlled conditions. Return to service using the approved startup sequence and retain the original evidence.
What to capture from each event
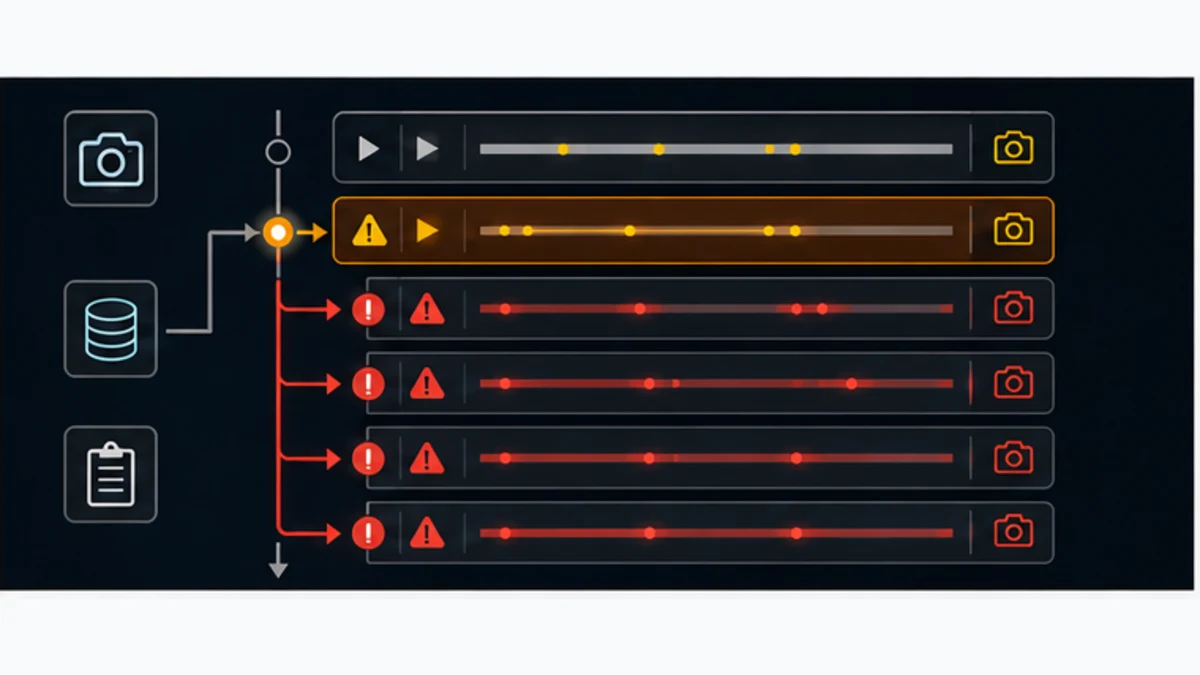
Create a small incident record containing:
| Evidence | Why it matters |
|---|---|
| CPU family, order number and firmware | Determines which manual and event format apply |
| TIA Portal version | Explains differences in menu names and supported firmware |
| Exact diagnostic-buffer text | More reliable than paraphrasing a number |
| Event ID and timestamp | Correlates PLC, drive, HMI and switch logs |
| Incoming/outgoing event state | Distinguishes a fault from its recovery event |
| Hardware identifier or logical address | Points to the configured device or channel |
| CPU mode before and after | Shows whether the fault stopped execution |
| Screenshot of Online device view | Preserves affected-module and channel context |
Freeze the target and access context
Before trusting online values, prove that the engineering station is connected to the intended controller. Record device name, IP/MAC where applicable, order number, serial number, firmware, CPU operating mode, protected access level and project/TIA version. On a line with similar CPUs, connecting to a reachable controller is not enough. Compare the physical cabinet identifier and network schedule with the online identity.
Go online as a read-first action. Do not download, change mode, acknowledge faults, assign a device name or factory-reset hardware until the incident state is captured and the action is authorized. Siemens documentation notes that a factory reset deletes diagnostic-buffer entries on supported S7-1200 paths. A reset performed for convenience can therefore remove the very evidence needed to explain recurrence.
| Context item | Record | Why it changes the diagnosis |
|---|---|---|
| CPU generation | S7-1200, S7-1200 G2, S7-1500, ET 200 CPU or legacy family | instructions, buffer capacity, displays, web functions and event response differ |
| exact order/firmware | full MLFB/article number and online firmware | manuals and compatibility are product/version specific |
| TIA/STEP 7 environment | edition, version, updates, HSPs and options | menus, supported targets and compile/download behavior change |
| project identity | approved archive/checksum and online/offline comparison state | an engineer can diagnose the wrong or stale project otherwise |
| access/security | user, role and established approved connection method | missing rights can look like a communications or download fault |
| time basis | CPU, HMI, drive, switch and historian clock offsets | unsynchronized events cannot be ordered reliably |
Choose the correct diagnostic surface
Online & diagnostics and Online device view
Use Online & diagnostics for CPU-level identity, mode, diagnostic buffer, cycle/memory information, interface properties and supported service functions. Use Online device view to navigate the configured rack or distributed station and open the specific module or channel reporting a diagnostic state. The available groups vary by target, firmware, selected object and TIA version; follow the current contextual help rather than a screenshot from another release.
The colored icons are navigation clues. Open the detailed record and retain the event text, status, hardware identifier and timestamp. A red parent device can reflect a fault in one lower-level component. A green CPU can coexist with a red remote station or bad channel. Always move from the summary icon into the leaf object before selecting a corrective action.
Diagnostics buffer, service data and web access
The CPU diagnostics buffer is a retained circular chronology of diagnostic events and operating-mode transitions. Siemens' current S7-1200 documentation states that the first displayed entry is the latest and documents up to 500 entries for that publication/version, while other help contexts and generations can expose different capacities. Do not turn one number into a cross-family promise. Export or capture the relevant window before entries roll over.
When a CPU or complex intermittent failure needs escalation, Siemens supports saving service data for applicable S7-1200/S7-1500 targets. Service data can contain detailed internal evidence useful to the manufacturer, but it may also expose project or operational information. Collect it through the approved procedure, retain the exact time/fault case and protect the package as sensitive engineering data.
The CPU web server can provide diagnostic access when it is explicitly enabled, configured and authorized. Its presence is not permission to expose the controller to untrusted networks. Use HTTPS, users/roles and network controls supported by the exact CPU and site design. Do not weaken access because a browser view is convenient during an incident.
GET_DIAG and application-visible quality
The current TIA Portal instruction reference documents GET_DIAG for S7-1200 and S7-1500 hardware-component diagnostics using a mode and hardware identifier. Other instructions and system data can expose module/device state for supported targets. Use the exact selected CPU's help for parameters, status values and call behavior; a copied magic value from a forum is not a maintained interface.
Application logic should consume a bounded health contract rather than parse every vendor event in the cyclic control path. For example, a remote-station interface may provide Configured, Reachable, DataValid, Fresh, SubstituteActive, Faulted and FirstFaultId states. The detailed diagnostic buffer remains for engineering; the HMI and sequence get stable process meaning.
| Surface | Strong use | Limitation or control |
|---|---|---|
| diagnostics buffer | order CPU/device events and mode changes | circular history; event detail varies by product/version |
| Online device view | localize configured device, module or channel | online color alone does not prove physical cause |
| online/offline compare | identify block/configuration differences | a difference may be approved, pending or unauthorized; investigate ownership |
| watch table/program status | observe selected live values and writers | observation load and forced/modified values must be controlled |
| trace | capture transient timing and sequence relationships | trigger, sampling and signal choice determine what can be concluded |
| web server | authorized remote status and diagnostics | must be enabled and secured; paths/features vary |
| service data | deep escalation evidence for supported targets | sensitive package; collect before disruptive actions where practical |
GET_DIAG/user diagnostics |
stable application response and HMI context | exact modes/types and hardware IDs are CPU/version specific |
What the Siemens CPU LEDs tell you
LED labels and flash patterns differ by exact CPU. Use the front-panel table printed in that CPU’s operating manual, not a table for a visually similar model.
| Indication | Safe interpretation | Next check |
|---|---|---|
| RUN lit | CPU is executing its cyclic program | Look for module/channel diagnostics if the machine is still unavailable |
| STOP lit | User program is not executing normally | Read the buffer for the event immediately before the mode change |
| ERROR lit or flashing | The CPU or configured system has diagnostic information | Open diagnostic buffer and Online device view |
| MAINT lit | Maintenance information is present | Read the maintenance event and device-specific diagnostics |
| Link/activity absent on a required port | No verified Ethernet link on that port | Cable, switch port, remote-device power and topology |
| Remote I/O/module fault LED | Fault is below the CPU level | Module diagnostics, load voltage and individual channel status |
Do not infer “replace the CPU” from a red LED alone. The same high-level indicator can accompany a missing remote station, configuration mismatch, shorted output channel or internal fault. Conversely, a CPU in RUN does not prove that field I/O is valid.
Reading the TIA Portal diagnostic buffer
- Select the PLC in the project tree.
- Choose Go online.
- Open Online & diagnostics.
- Navigate to Diagnostics → Diagnostic buffer.
- Select the newest event and expand its details.
- Follow any affected-device link or record the hardware identifier.
- Move backward until you find the earliest event that explains the later alarms or STOP transition.
The buffer is a chronological evidence source. A common pattern is:
10:14:31.421  Remote I/O station failure
10:14:31.437  Peripheral access unavailable
10:14:31.451  Application alarm: conveyor feedback lost
10:14:31.466  CPU mode transition
In that example, “conveyor feedback lost” is useful process context, but the station failure is the first infrastructure event. Investigating only the feedback alarm wastes time.
Do not clear the buffer until the incident record is complete. Clearing history does not repair the fault and may remove evidence needed by another technician or by Siemens support.
Live mini-lab
Try it: press START, then STOP
A stop-dominant seal-in rung: START latches the motor output through its own contact, and STOP breaks the circuit.
Watch the output lamp: it stays on after START until you press STOP.
Free · no signup to try · runs in your browserOpens plcsimulationsoftware.com — same team
Compare online and offline without overwriting evidence
Determine which source is supposed to be authoritative
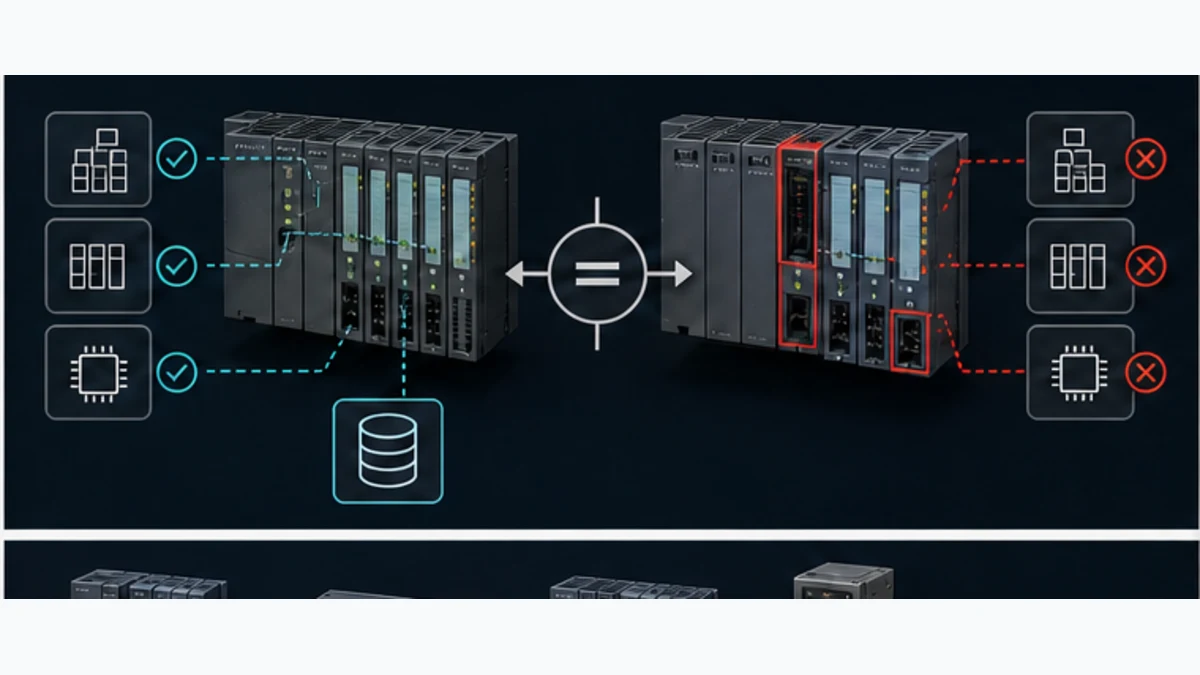
An online/offline difference is a finding, not an instruction to synchronize in either direction. The offline project may be the signed and tested design while the online controller contains an unauthorized emergency change. The online controller may instead contain the last approved production correction while the laptop holds an old archive. Establish configuration ownership, change history and backup requirements before uploading or downloading.
Start with target identity and hardware configuration: CPU/module order numbers, slot/subslot, firmware, network interfaces, device names, addresses and parameters. Then compare program blocks, DB structure/initial values, technology objects, libraries and safety-related signatures where applicable. Retained actual values are not the same as source/interface changes. Record each difference by category so operational data is not mistaken for an unapproved program edit.
| Difference category | Example | Safe next action |
|---|---|---|
| identity | connected CPU serial/order number differs from work order | stop and prove the physical target; do not download |
| hardware | replacement module or firmware differs from configured device | verify approved compatibility and module parameters |
| program source | online block code/checksum differs from archive | identify change owner, time, reason and test evidence |
| interface | FB/DB layout or UDT version differs | assess consumers, reinitialization and download scope before action |
| actual data | recipe, counter or retained state differs from offline start value | preserve operational data; do not treat as source mismatch automatically |
| safety | F-signature or safety configuration differs | follow the qualified safety change and acceptance process |
| security | users, certificates or protection level differ | involve the OT security/asset owner; do not bypass protection |
Preserve a recovery package before a risky change
Where the approved procedure and access permit, retain the current project archive or upload, diagnostic screenshots/exports, recipes/retentive data required for restoration, firmware manifest, device-description dependencies, certificates through the secure process and a tested rollback plan. Record the exact engineering workstation software and options. A source file without the matching TIA version, HSP, library and hardware manifest is not yet a recovery package.
After correcting the root cause, repeat the failed case plus adjacent regression cases. A compile or green online comparison proves consistency, not correct process behavior. Verify startup, mode transitions, field I/O, fault response, loss of communication, reset, deliberate restart and any safety validation required by the change.
Diagnose S7-1200 and S7-1500 faults by category
CPU in STOP
Work from the buffer rather than guessing:
- If the event points to a programming exception, open the referenced block and instruction and reproduce it with the captured input values.
- If it points to cycle-time monitoring, identify the long-running loop, communication call or interrupt load before changing the configured limit.
- If it follows a download, compare online/offline blocks and hardware configuration.
- If it follows a station failure or I/O access event, verify remote I/O state and the program’s designed response to invalid inputs.
- If it reports an internal hardware or firmware fault, preserve the diagnostic package and follow the device manual or Siemens support instructions.
Increasing a watchdog or maximum-cycle setting can hide a defect. Change it only when the calculated worst-case execution time is understood and accepted.
I/O module or channel fault
Use Online device view to select the exact channel, then check:
- Field/load supply voltage at the module terminals.
- Sensor or actuator wiring against the current drawing.
- Configured channel type and range.
- Whether wire-break, short-circuit or substitute-value diagnostics are enabled.
- Raw input value and its quality/status, not only the scaled engineering value.
- Fuse, electronic protection and shared commons.
- Module order number and firmware against the offline project.
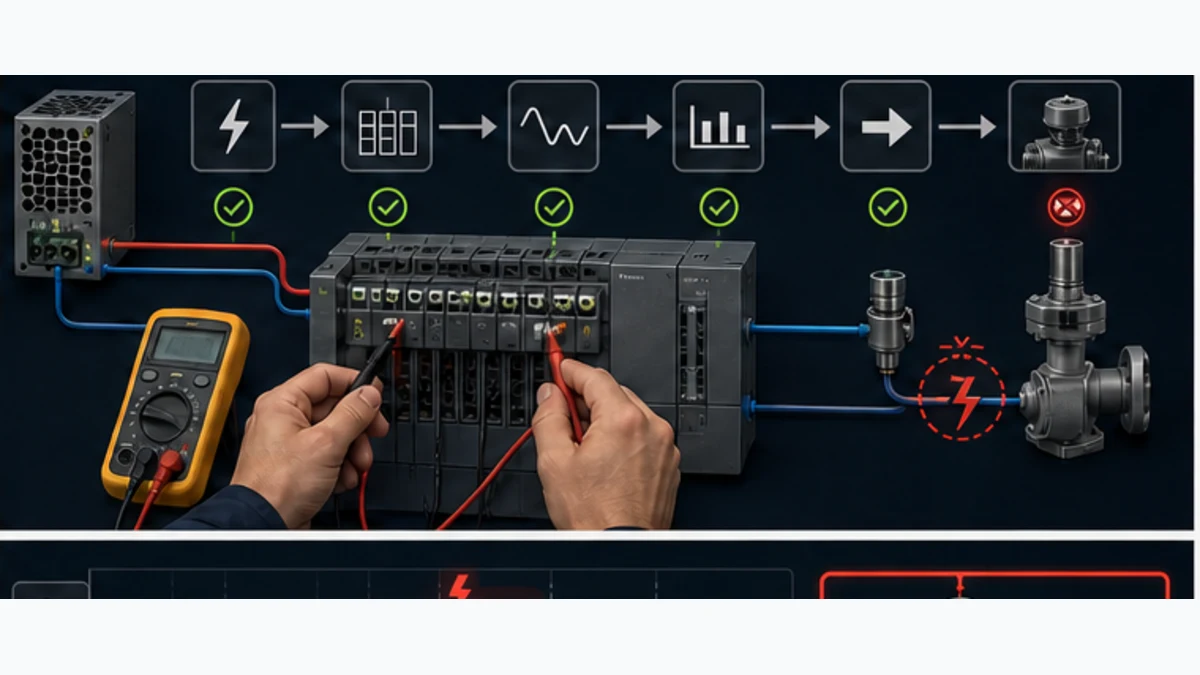
Analog input overrange, underrange or wire break
Siemens analog raw ranges and diagnostic substitute values depend on the module and configured measuring range. Treat familiar values such as 0–27648 as a starting point, not proof that every module and failure mode behaves identically.
Use this reproducible check:
- Record the configured signal type: 0–10 V, 0–20 mA, 4–20 mA, RTD or thermocouple.
- Read the module/channel manual’s representation table.
- Measure the signal at the input terminal with an appropriate calibrated instrument.
- Compare the raw PLC value with the expected value at two known points.
- Confirm the program separately handles bad quality, overrange and a valid low process value.
For a worked scaling method, use the PLC analog-input scaling guide and the analog scaling calculator.
PROFINET device missing or not exchanging data
Check in this order:
- Remote device power and load voltage.
- Link LEDs at both cable ends.
- Correct physical switch/port and known-good cable.
- Unique PROFINET device name.
- Expected IP/subnet configuration.
- Configured device, module and submodule order numbers.
- Controller/device relationship and data-exchange status.
- Managed-switch port counters, topology and ring status where applicable.
Do not rely on ping alone. A device can answer ICMP while its PROFINET name, expected module layout or cyclic application relationship is wrong.
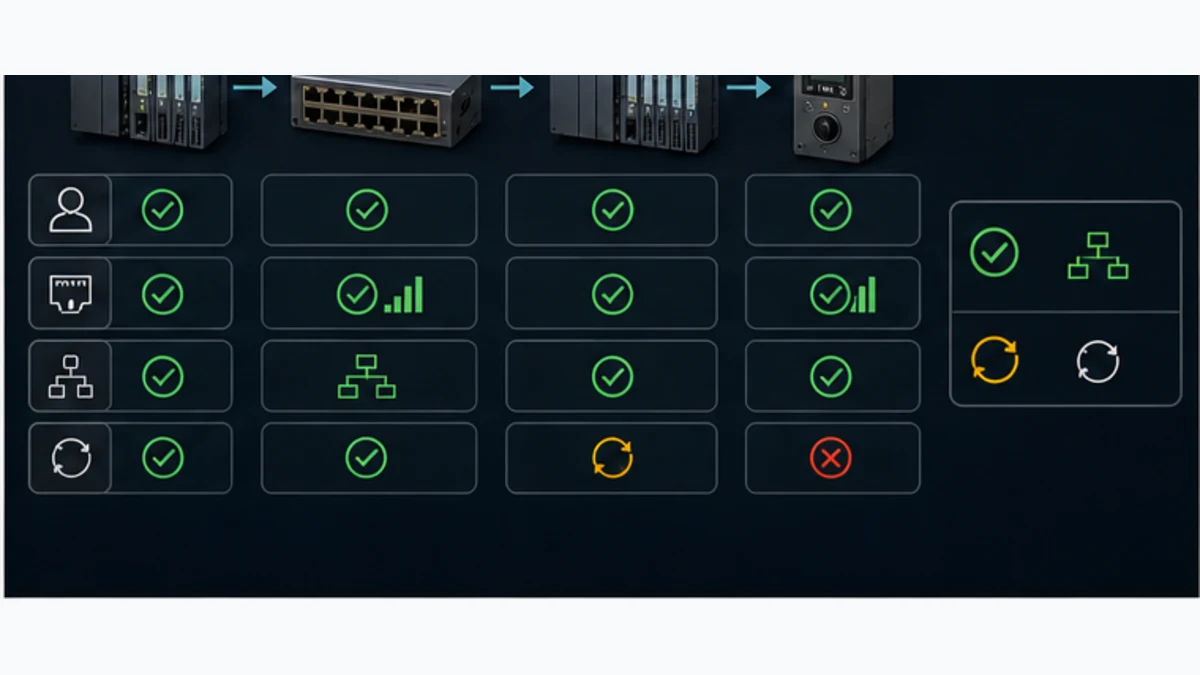
See the PROFINET troubleshooting tutorial for device naming and topology checks.
Hardware configuration mismatch
Compare:
- CPU and module order numbers;
- rack/slot positions;
- configured submodules;
- firmware versions;
- I/O addresses and hardware identifiers;
- technology object requirements;
- safety signatures and access protection, when applicable.
Do not “detect hardware” and overwrite the engineered project until you understand why the two differ. The offline project may be the approved design, while the physical rack contains an unauthorized replacement.
Compile or download failure
The TIA Portal compile output is already the primary error reference. Start with the first compiler error; later messages often cascade from it.
For a failed download:
- verify that you selected the intended network adapter and CPU;
- compare online/offline CPU identity;
- read the required access level and protection settings;
- check whether the change requires STOP;
- compile hardware and software consistently;
- review safety or fail-safe acceptance requirements before downloading;
- save a backup or upload according to the site change procedure.
Never recommend disabling firewalls or security controls as the default fix. Test routing and approved rules with the site’s OT security owner.
Logic says run but the machine does not move
Trace the control chain in one direction: request owner, operating mode, equipment state, permissives/interlocks, output command, mapping, configured channel, physical voltage, starter/drive state and process feedback. Stop at the first point where expected and observed evidence differ. If the application command is false, stay in logic and state ownership. If command is true but the mapped output is false, inspect writers, mapping, output enable and channel quality. If the physical output is correct but the actuator does not respond, move to qualified electrical, pneumatic, hydraulic or mechanical testing.
Use cross-references to find every writer of the command and reset. Program status can show current power flow, but a one-scan pulse or intermittent overwrite may be missed. A trace with a deliberate trigger can capture request, mode, permissive summary, state, command, raw output, feedback, timeout and first-fault ID around the event. Select a sample rate that can observe the transition and record the trigger condition in the incident file.
| Evidence sequence | Expected healthy relationship | Fault clue |
|---|---|---|
| request and mode | one authorized request exists in the permitted mode | request is absent, stale or written by competing owners |
| permissive/interlock | every required condition is true and diagnostic names the first false item | summary bit hides which condition failed |
| equipment state | state transition follows the approved sequence | state remains inhibited, resetting or faulted |
| logical command | command follows state and drops on protective condition | latch, priority or multiple-writer defect |
| mapped output | hardware-bound tag follows sanitized command | mapping/range/quality or output-enable defect |
| physical terminal | measured voltage/current matches channel state under approved test | field supply, channel, common, fuse or wiring defect |
| device feedback | starter/drive/valve and process response occur inside the timeout | protection, actuator, energy or mechanical/process failure |
Intermittent faults and CPU cycle-time events
Do not increase the maximum cycle time simply because a cycle-monitoring event occurred. Capture measured cycle times, communication load, higher-priority interrupts, loops, array bounds, data conversion, technology tasks, online observation and recent changes. Look for the first long cycle and the block or event active around it. Test under representative HMI, communication, motion and diagnostic load rather than an idle bench alone.
For sporadic device loss, correlate CPU diagnostics with managed-switch port counters, topology, drive logs, control-power monitoring and environmental timing. Compare counter deltas across the incident, not only lifetime totals. A large historical CRC count may be old; one new counter increment exactly when the station fails can be highly discriminating. Check the cable/connector and EMC installation through the approved physical procedure instead of repeatedly replacing electronics.
| Intermittent symptom | Capture together | Productive next split |
|---|---|---|
| rare CPU STOP | buffer/service data, cycle trace, task/interrupt load and recent download history | programming/cycle event versus power/internal hardware event |
| one PROFINET station drops | controller event, switch port deltas, device power and topology position | network media/identity versus local power/device reset |
| several stations drop | common upstream port/switch/power and controller interface evidence | shared infrastructure versus independent field faults |
| value freezes without station loss | raw value, quality, application heartbeat and producer task | transport healthy but sensor/device/application producer stale |
| output trips only under load | channel diagnostics, load voltage/current and actuator protection | PLC channel/field supply versus downstream load/protection |
| unexplained sequence reset | startup OB/state logic, CPU mode event, retained data and external reset writers | controller restart versus application reset command |
Forcing, modifying and watch tables
Forcing and modifying are controlled commissioning actions, not shortcuts around an unknown fault. Identify whether the operation changes a variable once, continuously overwrites it, or forces a physical I/O operand independently of normal program logic on the selected target. Record the exact target, tag/address, value, authorizer, start/end time and removal verification. Confirm how the CPU indicates active forces.
Never use a standard-program force as a substitute for a required safety function, and never force an output merely to see whether equipment moves before the electrical and process conditions are approved. Prefer simulation, a safe trainer or an isolated output test plan. At handover, verify that force tables, temporary bypasses, watch modifications and test-only code are removed, then run restart and recovery cases.
Safety and fail-safe diagnostics
A standard CPU diagnostic buffer can help correlate a trip, but it does not authorize bypassing a safety function. F-CPU, F-I/O, PROFIsafe and drive-safety diagnostics have product-specific signatures, passivation/reintegration behavior, access roles and validation requirements. Follow the current SIMATIC Safety documentation and the machine's safety procedure. Retain safety diagnostic evidence separately where the site's governance requires it.
The safe response is defined by the safety requirements and risk assessment, not by a generic statement such as “PLC goes to STOP.” Some hazards require energy removal; others require a controlled stop or continued operation of a protective function. Diagnosis must preserve that architecture while standard-control faults are investigated.
Error OBs: what they do and what they do not do
Siemens supplies organization-block mechanisms for diagnostic interrupts, rack/station events and access/programming errors. Which OB is available, what local data it exposes and what happens when it is absent depend on CPU family and event.
Common legacy names include:
| OB | Typical purpose | Engineering requirement |
|---|---|---|
| OB82 | Diagnostic interrupt from a configured module | Identify the affected hardware and create an actionable alarm |
| OB83 | Module insertion/removal event | Revalidate module state before using its data |
| OB85 | Program-cycle or requested-OB event on applicable CPUs | Diagnose the initiating event; do not suppress it blindly |
| OB86 | Rack, station or distributed-I/O failure/return | Invalidate affected data and drive the process to a designed state |
| OB121 | Synchronous programming error on applicable CPUs | Capture block/instruction context and correct the defect |
| OB122 | Peripheral I/O access error on applicable CPUs | Prevent unsafe use of stale or invalid process data |
An empty error OB is not a complete fix. It may prevent a CPU transition for some events, but it can also let the process continue with missing I/O or an unresolved program fault. A production handler needs to:
- identify the affected device or access;
- invalidate or substitute process data explicitly;
- inhibit commands that depend on that data;
- alarm with a timestamp and useful context;
- define recovery and reset behavior;
- retain enough evidence for root-cause analysis.
The exact instructions and local variables must come from TIA Portal help for the configured CPU. Siemens’ application example for S7-1500 diagnostics also shows that diagnostic settings must be enabled per module and that existing OB networks must be integrated deliberately rather than copied blindly.
Reproducible diagnostic test
Use a non-production trainer or a simulation/hardware-in-the-loop bench.
Test case: remote-I/O loss
Preconditions
- CPU is in RUN.
- A remote I/O device is exchanging cyclic data.
- Process outputs are isolated or connected to a safe trainer.
- The application has a defined
RemoteIoHealthyquality bit and alarm.
Procedure
- Capture the healthy device view and diagnostic buffer.
- Remove network communication at the approved test point.
- Record the first device event, any access events and application alarms.
- Verify that dependent outputs go to the specified safe or inhibited state.
- Restore the connection.
- Verify that data quality returns before automatic restart is permitted.
- Export screenshots and record actual response time.
Pass criteria
- The first causal event is identifiable.
- Stale inputs cannot enable motion or heat.
- Recovery does not create an automatic hazardous restart.
- Operator message names the device and corrective check.
- Evidence remains available after the test.
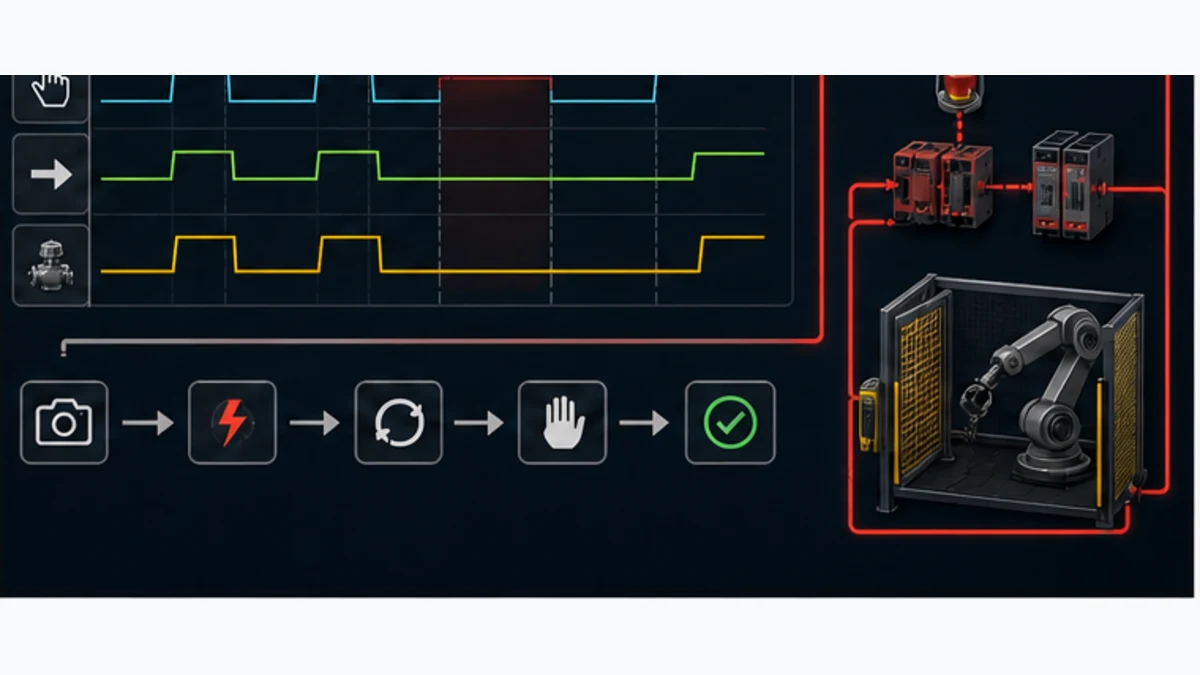
Expand the bench into a six-case diagnostic acceptance set
One remote-I/O disconnection proves only one path. A maintainable Siemens project should demonstrate how it reports and survives representative CPU, I/O, program, network and recovery failures. Run tests on a non-production trainer, simulation/HIL environment or approved commissioning state. Where physical failure injection is unsafe, test the application contract through an approved simulation point and document what remains unproven on real hardware.
| Case | Controlled stimulus | Required evidence and response |
|---|---|---|
| denied start | make one named permissive false before request | HMI/diagnostic identifies the first false condition; output never energizes |
| feedback timeout | inhibit approved feedback while command path remains active | request, command, timer, first fault and defined output response are captured |
| channel fault | use supported module diagnostic simulation or approved field break | Online device/channel detail and application quality agree; invalid value cannot drive logic |
| station loss | remove the approved PROFINET test link or device power | first network/power event precedes consequences; dependent commands inhibit as specified |
| CPU restart | perform approved restart with machine energy controlled | startup states, retained data and outputs follow specification; no uncommanded restart |
| restoration | repair the single cause and acknowledge through normal controls | quality and readiness rebuild before reset; a fresh start request is required where specified |
For every case, save the initial state, stimulus time, diagnostic events, trace or watch evidence, expected/actual response, maximum detection time, restoration sequence and reviewer. A screenshot showing a red icon is not a completed test record. The record must connect the fault to the process response and prove that repair did not introduce an unsafe or hidden automatic restart.
Escalate with a reproducible evidence package
If the cause remains unresolved, send Siemens or the equipment supplier a compact package: exact CPU/module order numbers and firmware, TIA version/updates, protected project or reproducible extract, diagnostic-buffer export/screenshots, relevant service data, event time and clock offsets, online/offline comparison summary, network topology/port evidence, power measurements, steps to reproduce, actions already tried and the observed versus expected response. Remove credentials and unrelated proprietary data according to the approved support process.
Avoid paraphrasing the error into “PLC stopped again.” Preserve the exact text, IDs and affected hardware reference. State whether the event is incoming or outgoing and whether it clears after repair. A supplier can act on a versioned, timestamped reproduction far faster than on a universal-code request detached from its device and firmware.
Siemens diagnostic source hierarchy
Use sources in this order:
- The installed device’s operating/system manual, found by order number in Siemens Industry Online Support.
- TIA Portal contextual help for the selected CPU, instruction or diagnostic event.
- The online diagnostic buffer and device view from the affected system.
- Siemens application examples, after verifying their supported CPU and TIA versions.
- Site-approved drawings, network files, backups and change records.
Useful primary references:
- Siemens S7-1500 diagnostics and configuration-control application example
- Siemens Industry Online Support
- Siemens PROFINET resources
This page is an independent troubleshooting guide and is not Siemens documentation. Siemens, SIMATIC, S7 and TIA Portal are trademarks of Siemens AG.
Practice the sequence without production risk
PLC Simulation Software can be used to practise the diagnostic thinking that happens before a vendor-specific TIA Portal session: reproduce a stopped sequence, observe permissives, test timer and state transitions, and prove a safe restart.
Ownership disclosure: PLC Programming and PLC Simulation Software are operated by the same publisher. The simulator is a training product, not a Siemens CPU emulator and not a replacement for TIA Portal device diagnostics.
Use the disclosed diagnostic-practice CTA on this page to build a fault-and-recovery exercise, then use the exact Siemens manuals and TIA Portal help when working on S7 hardware. The learning model can train evidence order, permissives, timeout and recovery; it cannot reproduce the installed CPU firmware, device descriptions, field power, network timing, access control or safety response.
Frequently asked questions
What should I check first when a Siemens PLC shows a red error LED?
Make the process safe, preserve the LED state, then read the newest causal event in Online & diagnostics → Diagnostics → Diagnostic buffer. The red LED is a category indicator; the event and affected-device diagnostics identify the actionable fault.
Why does my S7-1200 or S7-1500 go to STOP?
Common categories include a programming/runtime error, cycle-time monitoring, a download/configuration issue or a hardware/internal event. The exact cause is the event immediately before the STOP transition. Do not assume that adding an empty OB or increasing the cycle-time limit is a repair.
Can I clear a Siemens PLC error by clearing the diagnostic buffer?
No. Clearing the buffer deletes history; it does not correct wiring, configuration, code or hardware. Preserve the evidence, repair the root cause and then clear only if the site procedure calls for a clean baseline.
Does a PROFINET device responding to ping mean it is healthy?
No. Ping confirms IP reachability. A PROFINET device must also have the expected device name, configuration, module layout and cyclic controller relationship.
Should every Siemens project include OB82, OB86, OB121 and OB122?
Use the OBs supported and required by the configured CPU and risk assessment. Each handler needs an intentional process response, data-quality rule, alarm and recovery path. Copying empty OBs into every project can mask unresolved faults.
How do I find the first cause in a long TIA Portal diagnostic buffer?
Record the incident time, then move backward from the visible symptom or STOP transition until an earlier event explains the later cascade. Compare incoming and outgoing status, affected hardware ID and timestamps. A station-loss or field-power event often precedes access errors and process alarms. Retain the complete relevant window before resetting or clearing anything.
What is the difference between program status, a watch table and a trace?
Program status shows live execution context for observed logic, and a watch table monitors selected values while supporting controlled modify/force workflows. A trace records chosen signals at a configured sampling cycle around a trigger, which is better for short pulses, timing and intermittent sequence faults. Availability, capacity and load depend on the exact CPU and version.
Can I diagnose an S7-1200 without downloading the project?
Yes, many first-line checks are read-only: prove target identity, open Online & diagnostics, inspect the diagnostic buffer and device view, compare online/offline state, and collect approved service/network evidence. Access rights and an appropriate project can affect available detail. Do not download merely to establish a connection.
Why is my Siemens PLC in RUN when the machine is still faulted?
RUN means the CPU is executing its program; it does not prove remote I/O, individual channels, field supplies, permissives, actuators or the process are healthy. Trace the request-to-feedback chain and inspect device/channel quality. A well-designed application can remain in RUN while safely inhibiting only the affected equipment.
What should I send to Siemens support for an intermittent PLC fault?
Send a protected, reproducible package: exact order numbers and firmware, TIA version, event time and clock context, diagnostic-buffer evidence, applicable service data, online/offline summary, network/power evidence, reproduction steps and actions already tested. Follow the approved process for credentials, certificates, source and proprietary plant data.
Related Siemens resources
- Siemens PLC programming tutorial
- TIA Portal programming tutorial
- PLC troubleshooting guide
- PROFINET protocol tutorial
- Siemens PLC certification guide
- PLC scan-cycle guide
Sources, review scope and limitations
This page was reviewed on August 30, 2026 against current Siemens material available for TIA Portal V20/V21 and current S7-1200/S7-1500 families. Siemens menu paths, buffer sizes, instructions, event behavior and diagnostic capacity vary by exact CPU, firmware and engineering version. Installed manuals, contextual help, approved project records and measured field evidence remain authoritative for the machine.
- Siemens, Diagnostics Overview for SIMATIC S7-1200 and S7-1500.
- Siemens TIA Portal V20, Displaying diagnostic events in an S7-1200 CPU.
- Siemens TIA Portal V20, Reading out the diagnostics buffer of a CPU.
- Siemens TIA Portal V21, Basic information on the diagnostics buffer.
- Siemens TIA Portal V20,
GET_DIAG: read diagnostic information. - Siemens TIA Portal V20, System diagnostics for S7-1500 PLCs.
- Siemens, S7-1500 Diagnostics function manual, 11/2024.
- Siemens TIA Portal V20, Saving service data for S7-1200 and S7-1500.
- Siemens TIA Portal V20, S7-1200/1500 CPU trace functions.
- Siemens TIA Portal V20, Guide to using a trace.
- Siemens S7-1200 V20, Watch tables and force tables.
- Siemens, S7-1200/1500 Programming Guideline.
- Siemens, S7-1200 system manual V4.6.
- Siemens, S7-1500 diagnostics and configuration-control application example.
- Siemens, PRONETA PROFINET commissioning and diagnostics tool.
- Siemens TIA Portal V20, Using online and diagnostics functions.
- Siemens, PROFINET with STEP 7 function manual, 11/2025.
Now run it · free · no signup
Diagnose a PLC fault in your browser
Start with a no-account motor diagnostic, then work through guided wiring, logic and scan-order fault labs with graded feedback.
Ownership disclosure: PLC Programming IO and PLC Simulation Software are operated by the same publisher.