PLC Watchdog Timer: Scan Time, Faults and Diagnosis
Understand PLC watchdog timers, scan cycles, task periods and overruns; measure worst-case execution, diagnose timeout faults and choose a defensible recovery path.
Direct answer
A PLC watchdog timer supervises whether a controller, task, scan or expected application event completes within a defined time. If the supervised work exceeds its deadline, the platform records a timeout or overrun and applies its configured fault behavior. Depending on the exact controller and watchdog layer, that behavior can include calling a fault handler, halting one application, putting the CPU into a fault or STOP state, resetting the controller, warning only, or driving outputs to product- and project-defined states. “The watchdog always turns every output off” is not a safe universal rule.
A watchdog fault means a timing boundary was exceeded. It does not prove why. Common mechanisms include an unbounded loop, unexpectedly large data, slow or blocking logic, changed communications load, an online edit, higher-priority preemption, task overlap, processor saturation, firmware/hardware trouble or a threshold that was never validated under representative worst-case conditions.
When a watchdog trips, preserve the controller fault code, task, routine/program context, controller mode, scan/task statistics, timestamp and recent changes before clearing it. Then reproduce the load in an isolated environment, identify the first execution path that grew, correct that cause, and retest startup, maximum workload, communications, diagnostics, online maintenance and recovery. Increasing the timeout is a design change, not a diagnosis.
| Immediate question | Short answer | Evidence needed before action |
|---|---|---|
| Is a watchdog an ordinary PLC timer instruction? | No; runtime supervision and application TON logic have different owners and failure modes. |
exact task/controller documentation and project configuration |
| Did the program necessarily enter an infinite loop? | No; a loop is one cause among many. | task maximum time, preemption, input data, call path and fault log |
| Should I just raise the preset? | Not until the timing requirement and worst-case execution are understood. | representative trace, margin rationale and approved reaction time |
| Will outputs turn off? | Product, task, I/O, safety and project configuration determine the reaction. | exact controller/I/O manuals and validated safe-state design |
| Can the fault be cleared remotely? | Only if the approved recovery procedure and risk assessment permit it. | authorization, original evidence, machine state and restart controls |
This page owns the combined PLC watchdog timer, scan time, task-overrun and scan-cycle diagnosis task. The shorter scan-cycle glossary definition remains the quick reference. Use PLC program debugging for broader online-monitoring and trace methods, and PLC CPU, power and memory troubleshooting when controller resets or faults may not originate in the application.
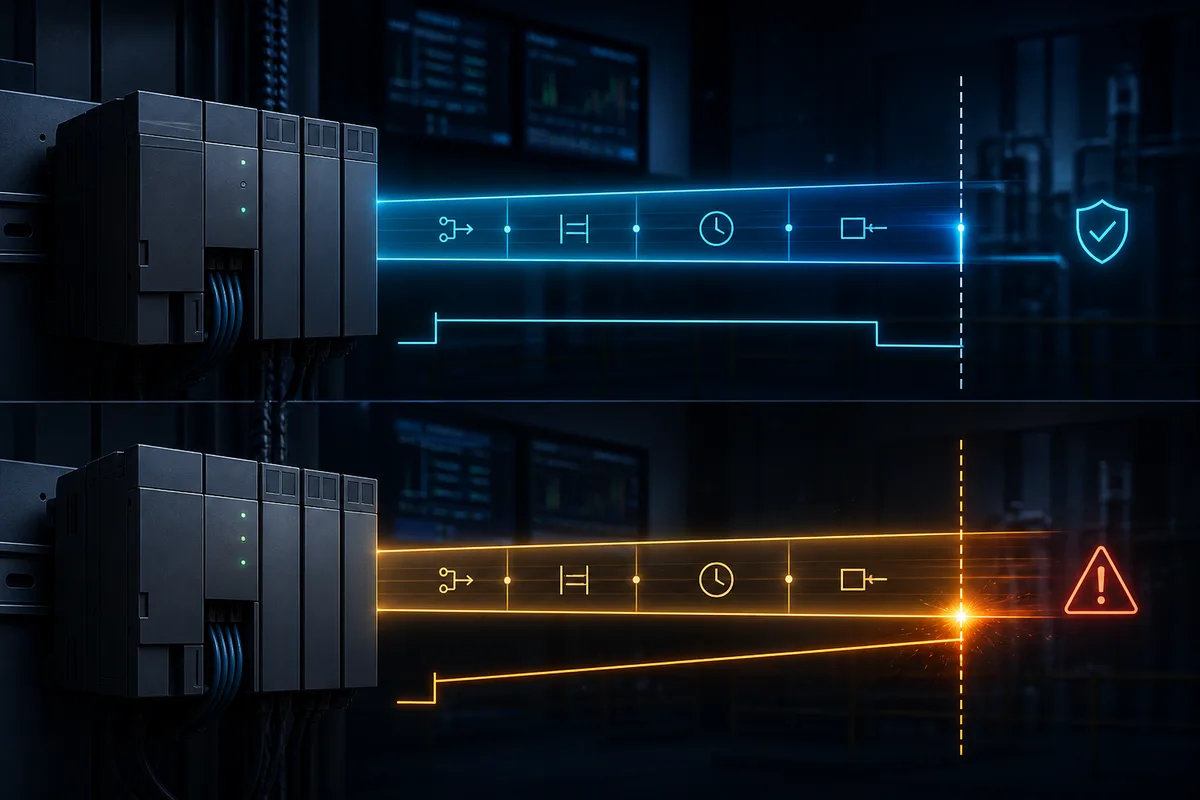
What a PLC watchdog is—and is not
Runtime supervision is different from an application timer
A task or system watchdog belongs to the controller runtime or hardware. It can still act when the user program cannot reach its next instruction. A TON or similar application timer is executed by the very task it is meant to observe. If that task stalls inside a long loop before the timer is evaluated again, its accumulated value may not advance in a useful way. Therefore an ordinary timer cannot replace runtime supervision of that same execution context.
An application timeout remains valuable for a different question: did a commanded field event occur in time? For example, a motor command may be true while running feedback remains false for five seconds. The controller scan can be completely healthy during that equipment failure. Conversely, a task watchdog can expire even though no motor command is active.
| Mechanism | What it supervises | Typical owner | What a timeout proves | What it does not prove |
|---|---|---|---|---|
| hardware/system watchdog | firmware, processor service or global resource health | controller vendor/runtime | a protected system condition exceeded its threshold | that user logic alone caused it |
| task watchdog | one scheduled task from start through completion | controller runtime/project | task completion exceeded the configured boundary | which routine or interruption consumed the time |
| maximum cyclic-scan time | cyclic execution and relevant interruptions/services | controller runtime/project | the cyclic program exceeded its configured time | that all other tasks or networks are unhealthy |
| network watchdog | expected cyclic packets/data updates | protocol stack/device | accepted communication updates were absent or late | whether cable, power, scheduling, identity or application caused it |
| application heartbeat | remote software changed a sequence/value as designed | user application | expected application progress was not observed | that transport or remote hardware is the only cause |
| command-feedback timeout | physical/process response after a request | equipment logic | defined feedback did not arrive within the process deadline | that the PLC task overran |
“Watchdog timer” can name several layers
Schneider Electric’s current Modicon M262 documentation explicitly separates firmware-managed system watchdogs from configurable per-task watchdogs. CODESYS defines task watchdog time and sensitivity. Rockwell Logix controllers associate a watchdog with each task. Siemens S7-1500 documentation calls its cyclic boundary maximum cycle time or cycle monitoring time and uses the time-error organization block OB80. Beckhoff TwinCAT task properties include cycle-exceedance warnings and watchdog cycles. These are related ideas, not interchangeable configuration fields.
Always name the layer in a fault report: “MainTask exceeded its 50 ms task watchdog” is actionable; “watchdog problem” is not. Record the platform, CPU, firmware, task, task type, period, priority, watchdog setting, measured time and resulting state.
PLC scan cycle, task period and execution time
The four-phase scan is a teaching model
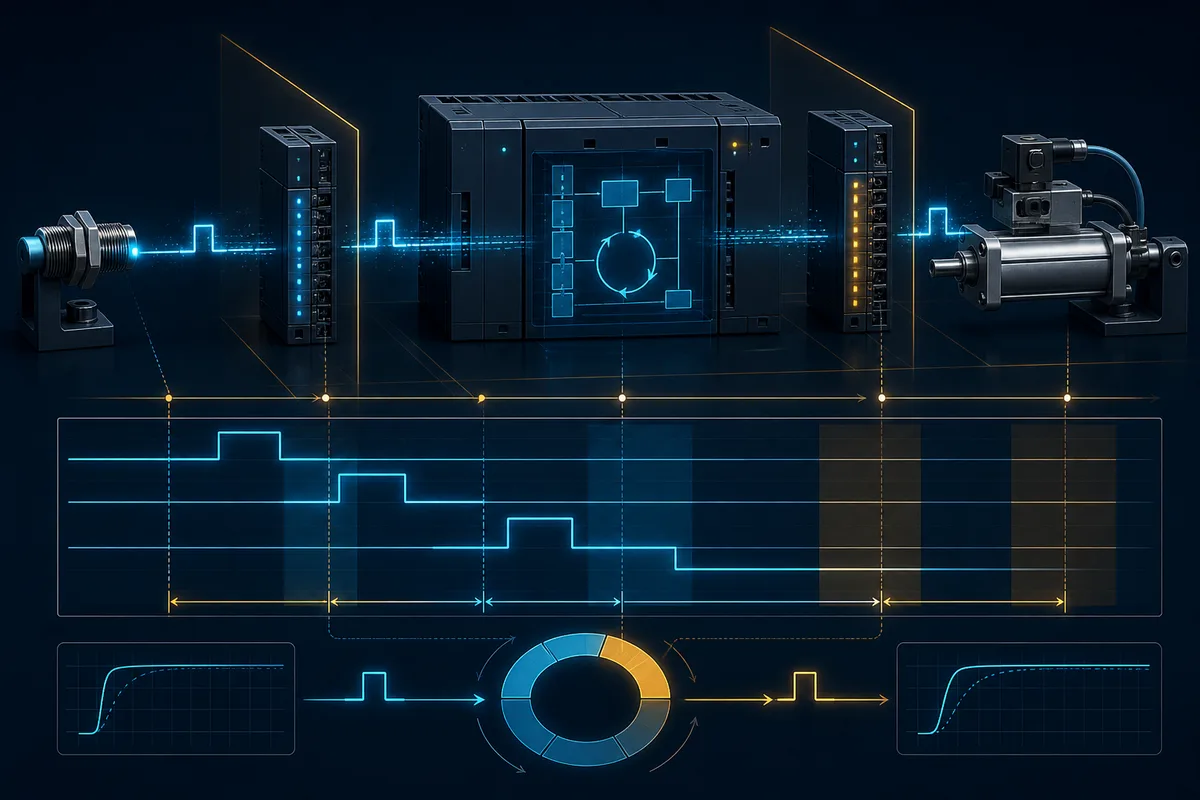
The familiar scan model is input-image update → user logic → output-image update → system services → repeat. It explains snapshot inputs, rung order and deferred outputs on many simple cyclic controllers. It is not a universal timing contract. Modern PLCs can schedule continuous, periodic and event tasks; allow higher-priority preemption; update distributed I/O asynchronously; execute immediate I/O instructions; run communications concurrently; and assign separate process images to tasks.
Use the model to form a hypothesis, then use exact documentation and task diagnostics to prove behavior. For example, a physical input can change between a remote module’s update, a network transfer, a task-specific input copy and user logic. “It changed during the scan” is insufficient unless the relevant update boundary is known.
Keep four timing quantities separate
Task execution time is CPU time or elapsed completion time for one invocation, according to the platform’s definition. Task period is the interval between requested starts of a periodic task. Scan/cycle time often describes one pass through a continuous cyclic context plus product-defined services and interruptions. Jitter is the variation between intended and actual start/completion timing. A watchdog threshold is another value; it is not automatically the task period.
| Quantity | Example question | Common mistake | Better measurement |
|---|---|---|---|
| execution time | how long did this invocation take? | recording only one online value | current, minimum, maximum and distribution under named load |
| period | how often should the task be released? | assuming every release starts exactly on time | scheduled versus actual start timestamps |
| response time | how long from field event to verified actuator response? | equating response with logic execution | input update + scheduling + logic + output update + field response |
| jitter | how much does timing vary? | relying on an average | percentile/histogram and maximum with test context |
| watchdog | what completion boundary triggers a reaction? | copying another project’s preset | documented requirement plus representative worst-case evidence |
| utilization | how much scheduling capacity is consumed? | treating a simple ratio as a vendor guarantee | measured runtime/load plus vendor scheduling analysis |
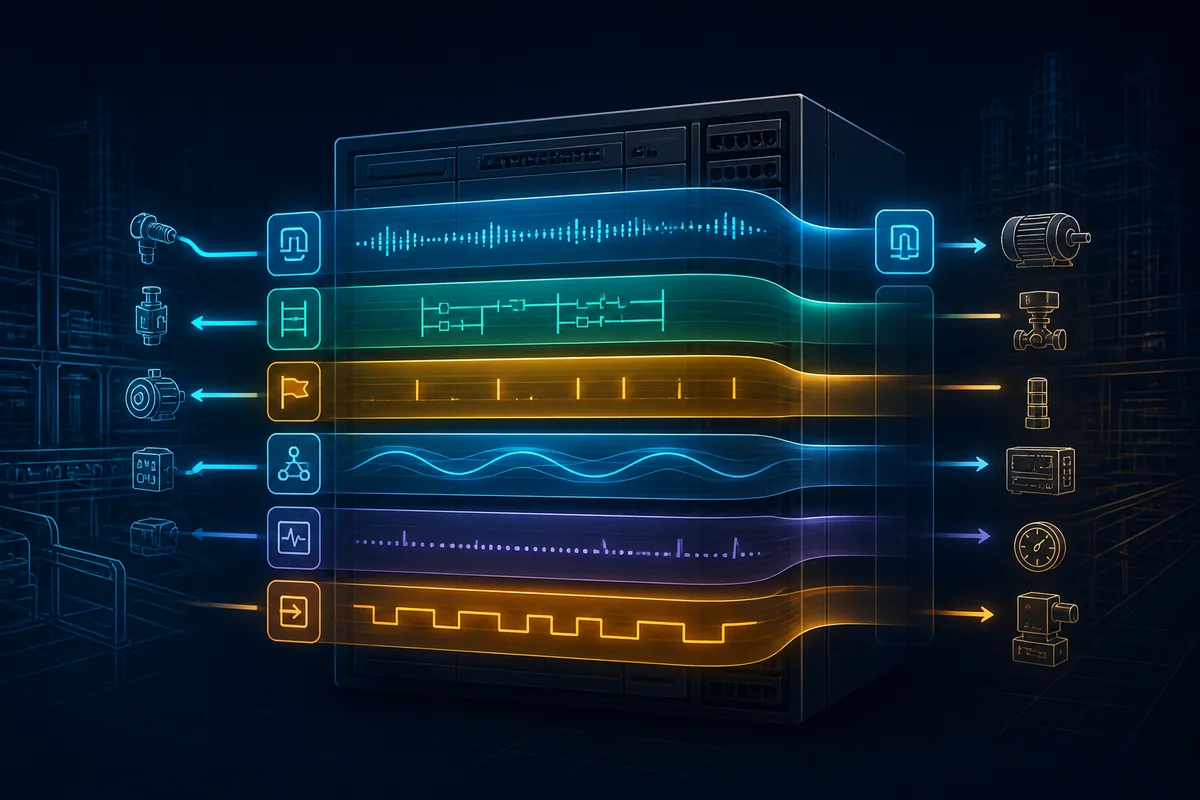
How a task watchdog detects an overrun
Start, deadline and completion belong to the runtime
Conceptually, the runtime arms supervision when protected work starts, observes completion, and triggers the configured reaction if completion arrives too late. The details differ. Rockwell’s September 2025 task manual states that its task watchdog begins when the task is initiated, stops after all programs in the task run, and includes time spent interrupted by other tasks. CODESYS combines watchdog time with sensitivity. Siemens monitors the cyclic program against maximum cycle time and attempts OB80 on a time error. Do not transfer one product’s semantics into another project.
A higher-priority task can make a lower-priority task exceed elapsed completion even if the lower task’s own instruction path did not grow. Likewise, a periodic task can overlap—be requested again before the previous invocation completes—without using the same diagnostic name as a watchdog timeout. Capture both release/overlap and execution evidence.
Sensitivity and repeated overruns change the meaning
In current CODESYS documentation, sensitivity can represent consecutive timeouts and can also form a longer one-cycle limit: with time 10 ms and sensitivity 5, the documented single-timeout example is 50 ms. On Siemens S7-1500, current documentation distinguishes the first maximum-cycle-time exceedance, where OB80 may run, from a second exceedance in the same cycle, which can put the CPU into STOP. Rockwell documents that a controller fault handler can clear a watchdog fault, but if the same fault occurs again during the same logic scan the controller enters Faulted mode.
Those examples show why “it happened twice” is ambiguous without a product-specific record. Consecutive task invocations, two exceedances inside one cyclic execution, and a repeated fault after a handler are different mechanisms.
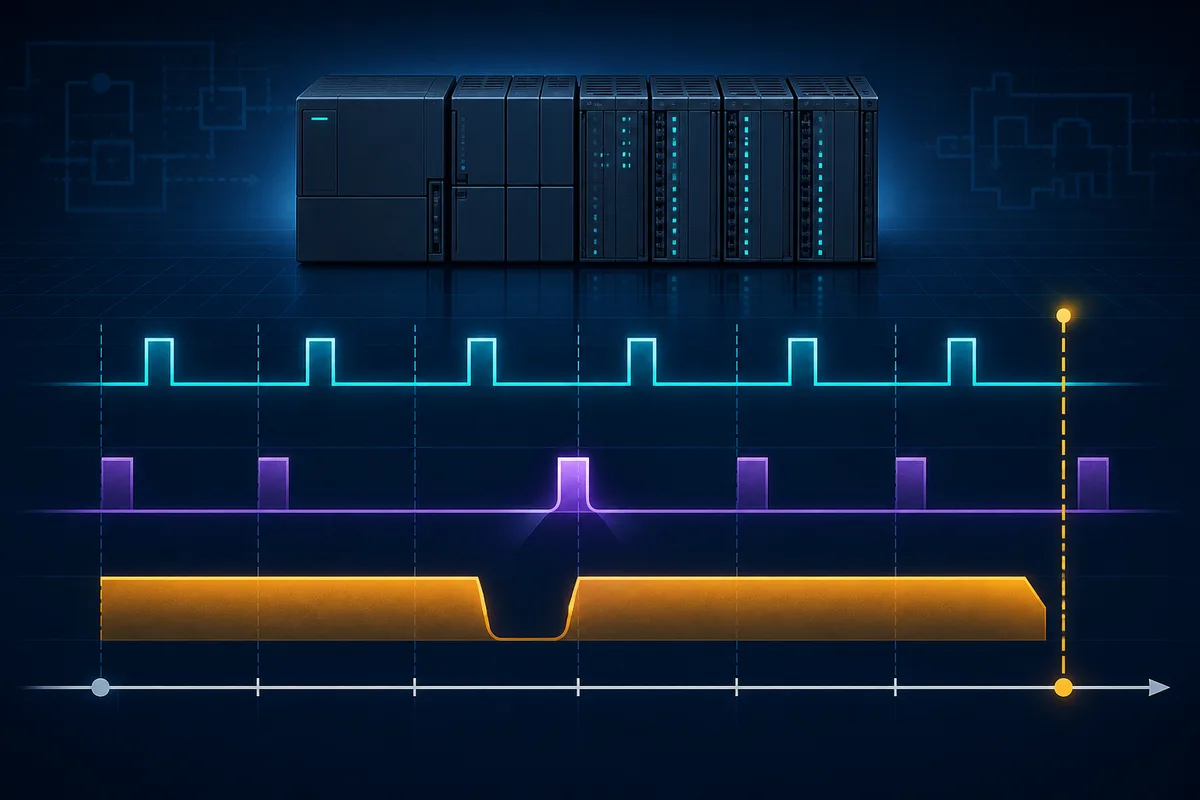
Cross-vendor watchdog behavior
Compare semantics before comparing presets
The table below is a navigation aid, not a substitute for the exact CPU manual. Values and reactions are deliberately tied to the cited current product documents.
| Platform example | Supervised boundary | Documented configuration/behavior | Diagnostic caution |
|---|---|---|---|
| Rockwell Logix 5000 standard task | task initiation through completion of scheduled programs, including interruptions | task watchdog 1–2,000,000 ms; documented default 500 ms; timeout causes a major fault | fault handler and repeated-fault behavior matter; safety tasks have additional rules |
| Siemens S7-1500 cyclic program | cyclic runtime including defined interruptions/system activity | maximum cycle time; current manual gives default 150 ms and configurable 1–6000 ms for non-redundant CPUs; OB80 handles first time error when present | R/H CPU and firmware behavior must be read separately; RE_TRIGR changes supervision and needs design review |
| CODESYS task | configured task execution | watchdog time plus target-dependent sensitivity; exception can halt affected application/children and output behavior depends on PLC settings | defaults/limits come from the device description; generic IDE behavior is not target proof |
| Schneider Modicon M262 | firmware resource conditions and optional application tasks | separate non-configurable system watchdogs and configurable time/sensitivity per task; documented reactions include HALT or reboot/EMPTY for specific conditions | distinguish task exception from processor-load or hardware watchdog codes |
| Beckhoff TwinCAT task | task-cycle exceedance monitoring | task properties can issue warnings after configured watchdog cycles | a warning threshold is not the same reaction as another vendor’s CPU major fault |
Safety-task watchdogs require the safety calculation
Do not apply standard-task tuning advice to a safety task. Rockwell’s current GuardLogix documentation, for example, ties safety-task period and watchdog to system reaction time and documents a safety-task reaction equation for the specified controller family. That calculation then combines with sensor and actuator reaction times. Other safety PLCs use their own certified models.
A standard PLC watchdog, network heartbeat or application timeout does not create a required Performance Level or Safety Integrity Level. Safety functions need an approved safety-requirements specification, architecture, component data, calculation, program verification, validation and proof testing. A longer timeout can lengthen fault reaction; a shorter one can cause nuisance trips. Both can be consequential.
What happens when the watchdog expires
Fault reaction is not universally “all outputs off”
The controller may stop the affected application, enter HALT/STOP/Faulted state, invoke a handler, reboot, preserve diagnostics or issue only a warning. Local I/O, distributed I/O, motion, drives and communications can each have configured behavior on controller fault, connection loss or stale data. An output module may de-energize, hold last state, substitute a value or follow a safety reaction—depending on approved configuration and hardware.
Therefore record the whole reaction chain:
| Layer after timeout | Question to prove | Source of truth |
|---|---|---|
| CPU/runtime | which task/application/controller state results? | exact controller/runtime manual and fault handler |
| local output | what happens on CPU stop/fault or backplane loss? | module configuration and hardware manual |
| remote I/O | what is the connection-loss action and timeout? | adapter/module configuration and network diagnostics |
| drive/robot | does it stop, coast, hold or use a local sequence? | device state machine and approved parameter set |
| standard application | which request, validity and restart bits are cleared? | reviewed program and interface contract |
| safety system | which safe state and reaction time were validated? | safety requirements, calculation and witnessed test |
| operator layer | what alarm, first-out and recovery guidance appears? | alarm philosophy and HMI/SCADA acceptance test |
Preserve the pre-fault and restart story
If a watchdog fault changes outputs or controller state, clearing it can initiate another transition. Preserve demand states, mode, retained values, sequence step, fault handler data and remote-device states. Require a deliberate restart where the risk assessment calls for it. A controller returning to RUN is not proof that the machine is ready or that stale commands have been cleared.
Common causes of PLC watchdog faults
Application paths that grow unexpectedly
Unbounded or poorly bounded loops are obvious suspects, but data-dependent growth is more common than a literal endless loop. A loop may be safe for ten configured devices and fail after an expansion to five hundred. A string parser may encounter malformed termination. A state machine may call a diagnostic routine repeatedly only during a fault storm. An array index may create a separate execution fault rather than a watchdog. Trace the actual triggering data.
Recursion, synchronous file/database work, busy-wait delay code, repeated conversions, large sorts/searches and excessive per-element messaging can also grow execution. Some controller languages disallow or constrain features differently; use exact compiler/runtime documentation.
Scheduling, communications and maintenance load
A lower-priority task can be stretched by higher-priority periodic or event work. Too-short task periods can starve system services or create overlap. Network storms, many explicit messages, diagnostics, trace capture, HMI polling, redundant synchronization and online changes can alter load. Schneider’s M262 documentation specifically warns that an overly short cyclic period can prevent lower-priority/system processing and lead to system-watchdog limits. Rockwell’s high-availability guidance measures watchdog needs while synchronization and external systems are active.
| Cause hypothesis | Evidence that supports it | Evidence that weakens it |
|---|---|---|
| unbounded/data-dependent loop | routine trace stops advancing; execution scales with input count/value | task overruns with routine disabled and same load |
| high-priority preemption | lower task elapsed time grows with higher-task events; CPU trace shows interruptions | own execution time grows without changed preemption |
| periodic overlap | next release arrives before previous completion; overlap counter/fault changes | release spacing and completion remain bounded |
| communications load | overrun correlates with message bursts, polling or connection recovery | isolated network reproduces exactly without messaging path |
| online maintenance | edit/download/trace timestamps align with the event | fault occurs under locked unchanged production state |
| processor/resource saturation | multiple tasks/services lose margin; platform resource watchdog appears | one bounded routine alone consumes the added time |
| power/thermal/hardware issue | reset/error logs and measurements align with supply or temperature | repeatable software path triggers on a healthy lab controller |
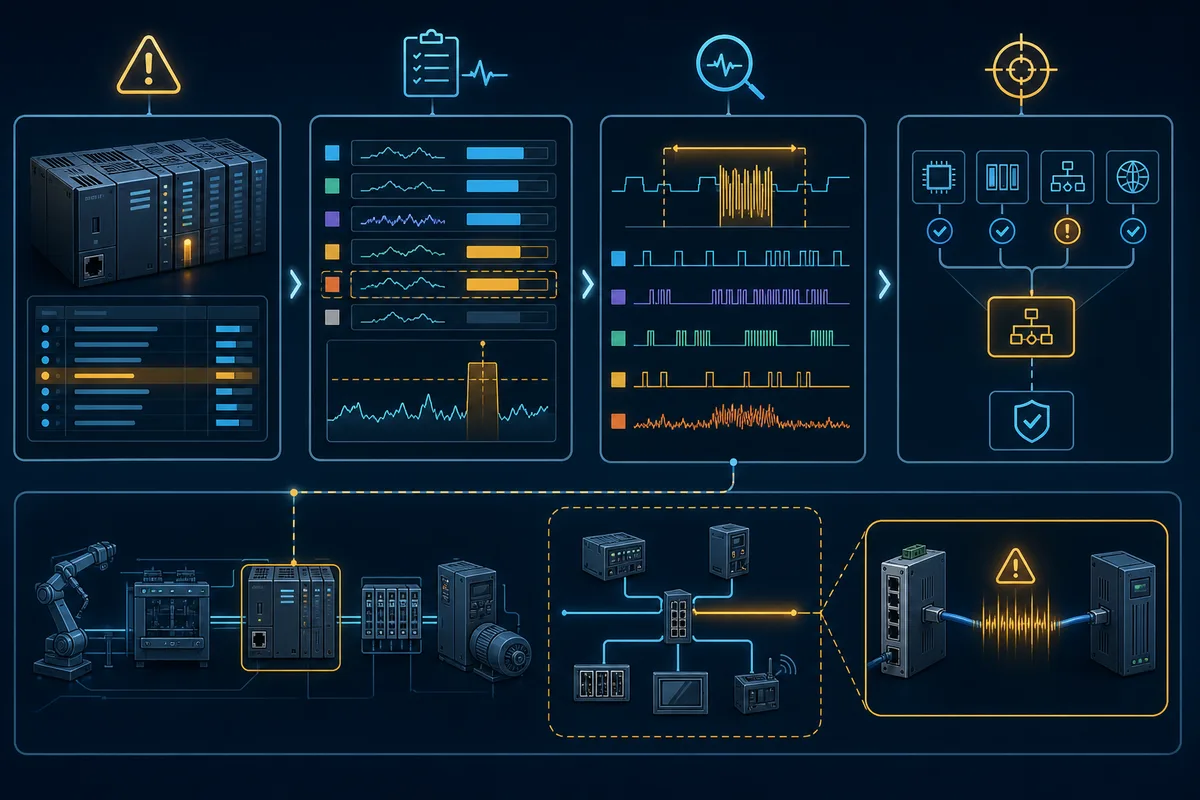
Measure scan and task timing correctly
Record a distribution, not one average
Average scan time answers a capacity question poorly and a watchdog question almost not at all. Record current, minimum and maximum values where the platform supplies them. Prefer a histogram or timestamped series that preserves rare tails. Name the operating state: idle, normal cycle, maximum recipe, changeover, alarm storm, network recovery, historian/HMI load, diagnostics active, redundancy event and authorized online maintenance.
Resetting a maximum statistic without recording time and context destroys evidence. Conversely, a maximum retained since an unknown commissioning event may not describe the current software. Use a controlled observation window and preserve both the raw result and configuration/version baseline.
Instrument without creating the fault
Tracing every tag at the fastest rate can change the load being measured. Start with native task statistics and fault logs, then add the smallest trace that distinguishes hypotheses. Use platform-supported clocks/timing instructions carefully; reading a clock inside a routine measures a bounded region but adds overhead and may not include preemption in the same way as runtime task statistics.
Vendor-neutral pseudocode for a lab-only routine measurement might look like:
start := MonotonicRuntimeClock();
ExecuteSuspectRoutine(TestData);
finish := MonotonicRuntimeClock();
elapsed := finish - start;

IF elapsed > retainedMaximum THEN
    retainedMaximum := elapsed;
    retainedTrigger := TestCaseId;
END_IF;
Use the exact platform’s monotonic time source and data types. Do not instrument a safety task or validated production routine without assessing execution and validation impact.
Worked scan-time and watchdog example
Build an elapsed-time budget
Assume a generic 20 ms periodic task. Under a representative high-load test, its own logic takes 6.8 ms. Higher-priority interruptions add as much as 4.1 ms of elapsed delay. Runtime/I/O service attributed to this completion window adds 1.7 ms. An authorized diagnostic trace adds 0.9 ms. The observed worst completion is therefore 13.5 ms in this example.
| Contributor | Observed worst case | Evidence source |
|---|---|---|
| task’s scheduled program execution | 6.8 ms | native task monitor plus bounded routine trace |
| higher-priority preemption | 4.1 ms | scheduler/task timeline |
| attributed runtime and I/O service | 1.7 ms | controller runtime statistics |
| approved diagnostic overhead | 0.9 ms | trace-off versus trace-on comparison |
| observed elapsed completion | 13.5 ms | task maximum/completion timestamp |
| configured example watchdog | 18.0 ms | reviewed task configuration |
| observed margin in this test | 4.5 ms | 18.0 − 13.5 ms |
The 4.5 ms difference is observed test margin, not proof of future worst case. The team still needs to test maximum recipe/data size, coincident events, network recovery, online maintenance, startup and environmental/processor conditions required by the project. It also needs to confirm that an 18 ms timeout and resulting response meet the machine/process risk and availability requirements.
Separate utilization from deadline proof
For independent periodic tasks, engineers sometimes begin with the rough utilization sum Σ(execution time ÷ period). That ratio can expose an obviously overloaded design, but it is not a complete schedulability proof. Priorities, preemption, blocking, I/O synchronization, runtime services, multicore allocation, event bursts and vendor scheduling rules matter. Use manufacturer tools and a qualified real-time analysis when deadlines are consequential.
Diagnose a PLC watchdog fault step by step
First preserve the controller evidence
Do not begin with a reset. Establish safe access, then record:
- complete controller/model and firmware;
- mode and exact fault/event code;
- affected task, program/routine and fault-handler information;
- task type, period, priority, watchdog and current/min/max statistics;
- event/overlap/preemption indicators;
- I/O and network states, including stale/invalid data;
- machine state, sequence step and retained values;
- timestamp, clock quality, operator action and recent change;
- project identity/checksum and current approved backup;
- output/restart behavior defined by the risk assessment.
Reduce the problem one boundary at a time
Use a known backup and representative hardware or an isolated test system. Reproduce with captured triggering data when possible. Disable or bypass suspected code only in a controlled diagnostic build, never by casually altering production protection logic. Compare task timing before/after one change. If the problem is load-dependent, increase dataset/device count stepwise until the growth curve becomes visible.
| Diagnostic step | Question | Stop condition |
|---|---|---|
| classify watchdog | hardware/system, task, cyclic, network or application? | fault report only says “timeout” |
| identify first event | which source recorded the earliest reliable timestamp? | later cascade alarms are being treated as causes |
| compare baseline | what changed in project, recipe, devices, traffic or firmware? | no trusted before-state exists |
| inspect scheduling | did own execution grow, or did interruptions/overlap grow? | only average controller load is available |
| isolate call path | which routine/block/data case consumes the extra time? | multiple changes are tested together |
| verify reaction | what did CPU, I/O, devices and machine actually do? | “outputs probably went off” is the recovery plan |
| correct and retest | does the fix pass all representative worst cases? | only the original normal cycle was rerun |
Do not hide the fault with the handler
A fault routine or OB80 can preserve data and coordinate a designed response. It should not repeatedly clear an unresolved overrun and continue as if control were reliable. Rockwell and Siemens both document escalated behavior for repeated timing errors in relevant contexts. Keep handler execution bounded, capture first-out evidence, command a validated response, and require appropriate operator/engineering intervention.
Choose a defensible watchdog setting
Start with the required completion and reaction time
The preset must be long enough for legitimate worst-case execution yet short enough to meet the process response and risk requirements. Those constraints can conflict. Define the controlled function, maximum acceptable stale/late control interval, fault reaction, safe state, restart behavior and availability consequence before choosing a number.
Then measure representative worst-case completion with the intended hardware, firmware, task set, communications, HMI/SCADA load, diagnostics, redundancy and maintenance operations. Add justified allowance for characterized variation and future approved growth—not an arbitrary multiple copied from a forum. Record who approved the value and what change triggers revalidation.
| Setting gate | Pass evidence | Failure response |
|---|---|---|
| exact semantics known | current controller manual and target/device description | stop; do not transfer another platform’s rule |
| workload bounded | maximum data/device/recipe and event assumptions recorded | redesign unbounded work before tuning |
| representative timing measured | distribution/max across declared operating cases | expand test coverage |
| process deadline met | control and fault-reaction budget approved | restructure tasks/architecture |
| fault behavior validated | CPU, I/O, device, alarm and restart test witnessed | correct configuration and retest |
| change control established | preset, rationale, test record and revalidation trigger archived | do not release |
Optimize architecture before loosening supervision
Move non-critical bulk work to a lower-priority or slower task where supported. Bound loops per invocation and retain progress explicitly. Break large communication operations into state machines. Reduce unnecessary polling and trace load. Use hardware capture, event tasks or dedicated motion technology for events that outrun the cyclic task. Select a CPU with adequate measured capacity if the workload is legitimate and cannot be reduced.
Application heartbeats and equipment watchdogs
Prove progress, freshness and validity separately
An application heartbeat should change monotonically or toggle according to an explicit contract. The consumer measures age from observed change and combines it with connection state, data quality, interface version and process validity. A permanently true “alive” bit cannot prove continued execution. A fast-changing transport heartbeat cannot prove that the equipment sequence still progresses.
IF RemoteSequence <> PreviousRemoteSequence THEN
    PreviousRemoteSequence := RemoteSequence;
    RemoteAge := 0;
ELSE
    RemoteAge := RemoteAge + TaskElapsed;
END_IF;

RemoteUsable := ConnectionHealthy
             AND DataQualityGood
             AND InterfaceVersionOK
             AND RemoteAge <= MaximumApprovedAge;

IF NOT RemoteUsable THEN
    RunRequest := FALSE;
    LatchFirstOut(RemoteDataUnusable);
END_IF;
This vendor-neutral pattern is a requirement example, not production code. Counter rollover, task timing, startup, communications loss, recovery, safety separation and exact data types must be designed and tested for the platform.
Avoid mutual-watchdog restart loops
If two controllers supervise each other and both automatically reset the other side’s request, one transient can create a repeating restart loop. Define ownership: who produces the heartbeat, who declares stale, which commands are inhibited, what local control remains, who acknowledges recovery and what state is required before restart. Preserve the first failed boundary on both sides.
Scan-sensitive faults beyond the watchdog
Short pulses can be missed without an overrun
A healthy cyclic task can miss an input pulse that begins and ends between relevant input samples. Compare pulse width, input filter/update, network transfer, task period and phase. Use an approved hardware latch, high-speed counter, timestamping input or faster/event task where every edge matters. Do not reduce a task period blindly; that may increase load and create the watchdog problem this guide describes.
Rung order and multiple writes create one-scan behavior
Within a sequentially executed routine, an internal value written earlier can be read later in the same invocation. A later write to the same output/tag can override an earlier result. Cross-reference every writer, inspect task/routine order and trace values scan by scan. Input/output process images and immediate/asynchronous operations remain vendor-specific.
| Symptom | Timing mechanism to test | Correct evidence |
|---|---|---|
| pulse never counted | input update and pulse width/phase | hardware trace plus module/task timing |
| output flashes one scan | multiple writes, edge logic or state transition | scan-by-scan tag trace and cross-reference |
| periodic task skips/overlaps | completion exceeds period or release handling | native overlap and task-start statistics |
| HMI value is stale while PLC runs | communication/update age rather than CPU watchdog | source/receive timestamp, quality and heartbeat |
| motion jitters | dedicated task/network synchronization and load | motion diagnostics, task jitter and drive trace |
| fault appears only while online | trace/edit/communication overhead or changed code | timestamped online activity and before/after timing |
Safe recovery and release testing
Clearing the fault is not the repair
Follow the site’s hazardous-energy, electrical-work and change-control procedures. Determine whether energized diagnostics are justified and authorized. Preserve evidence, verify mechanical/process state, remove initiating demand where required, confirm output/device states and establish who controls restart. A remote reset must never substitute for risk-controlled access.
After correction, test cold start, warm restart, maximum workload, task coincidences, invalid/maximum data, communication loss/recovery, I/O fault, alarm storm, diagnostics active, approved online maintenance, controller fault/STOP, power recovery and deliberate reset. Confirm that first-out evidence survives long enough to diagnose and that no retained request restarts unexpectedly.
Archive the timing acceptance record
| Record | Minimum contents |
|---|---|
| controller baseline | model, firmware, modules, project identity and engineering version |
| task configuration | type, period/event, priority/core, process image and watchdog settings |
| measured timing | raw series/histogram, max, operating cases and instrumentation overhead |
| fault evidence | exact code, task/context, timestamps and pre-fault state |
| reaction test | CPU, I/O, device, safety, alarm and restart observations |
| correction | code/configuration change, reviewer and rationale |
| acceptance | normal/negative/recovery cases, witnesses and unresolved limits |
| revalidation trigger | workload, firmware, hardware, task, communications or safety change |
Diagnostic answer map
| Question people ask search engines or AI assistants | Concise answer | Verification boundary |
|---|---|---|
| What is a PLC watchdog timer? | Runtime or hardware supervision that detects work exceeding a defined timing boundary. | identify the exact watchdog layer and platform reaction |
| What causes a PLC watchdog fault? | Long/unbounded code, data growth, preemption, overlap, communications, system load, maintenance activity or hardware/runtime faults. | preserve task statistics, fault context and triggering data |
| Is a watchdog the same as a TON timer? | No; a TON depends on task execution, while runtime supervision can detect that task failing to complete. |
inspect task configuration and application purpose |
| What is PLC scan time? | Product-defined elapsed time for a cyclic execution, often including relevant services and interruptions. | use the exact controller’s statistic definition |
| How do I calculate PLC response time? | Budget input update, scheduling wait, execution, output update, network and physical response. | measure phase and worst-case behavior on the target system |
| Should watchdog time equal the task period? | Not universally; platform semantics and safety/process requirements decide. | use manufacturer rules and a witnessed timing test |
| Does watchdog expiry turn outputs off? | Not always; CPU, I/O, network, device and project configurations govern. | validate every layer’s fault state |
| Can I increase the watchdog to stop faults? | Only after proving the cause, timing margin and acceptable reaction. | approved measurement, risk and regression record |
Frequently asked questions
What is a watchdog timer in a PLC?
A PLC watchdog timer supervises whether a controller, task, scan or other protected activity completes within a configured time. If it does not, the runtime or hardware applies its documented reaction. The exact scope, preset, fault code, handler and output behavior vary by controller and project, so record the specific watchdog rather than using the name generically.
What is the difference between PLC scan time and watchdog time?
Scan time is a measured or reported duration for cyclic execution according to the platform’s definition. Watchdog time is a configured supervision boundary. A healthy scan normally completes below that boundary, but one average scan value cannot justify the setting. Use a representative distribution, maximum conditions and the required process reaction.
What causes a PLC watchdog timer fault?
Possible causes include an unbounded or data-dependent loop, slow instruction path, higher-priority preemption, task overlap, excessive communications or diagnostic load, online changes, processor saturation, firmware/hardware trouble or an unvalidated threshold. A watchdog identifies the missed deadline, not the root cause; task and routine evidence must separate the hypotheses.
Does a PLC watchdog fault always turn every output off?
No. The controller may invoke a handler, halt an application, enter STOP/Faulted state, reboot or warn. Each local/remote I/O module and connected device can have its own hold, substitute, de-energize or safety reaction. Validate the exact controller, I/O, network, drive and machine behavior; do not rely on a universal “off” assumption.
How do I choose a PLC watchdog timeout?
Define the maximum acceptable control/fault-reaction time, bound the workload, measure representative worst-case elapsed completion on the intended system, account for justified variation, and validate the resulting CPU/I/O/device reaction. Follow the platform’s configuration rules. Document the rationale and revalidate after changes to tasks, code, hardware, firmware or communications.
Should the watchdog be longer than the task period?
There is no universal answer. Some platforms or task types constrain their relationship; others allow a wide independent range. A watchdog may include time while the task is preempted. Safety tasks can have certified reaction-time rules. Use the exact manual and measured schedule instead of copying a ratio from another PLC.
Can a TON timer replace a PLC task watchdog?
No. A TON is evaluated by application code. If that task stalls before evaluating it, the timer cannot reliably supervise the same stalled execution path. Use runtime task/system watchdogs for execution supervision and application timers for process contracts such as missing motor feedback or stale data.
How do I diagnose an intermittent PLC watchdog fault?
Preserve the exact fault/task context and a timestamped maximum or timing trace. Correlate it with triggering data, higher-priority events, network recovery, HMI/SCADA load, online work and environmental/controller diagnostics. Reproduce one variable at a time in an isolated system and retain the first execution boundary that grows.
What is Siemens PLC watchdog behavior for S7-1500?
Siemens documents maximum cycle time as S7-1500 cyclic-program supervision. If it is exceeded, the CPU attempts the time-error OB80; without OB80 the CPU can enter STOP, and a second exceedance in the same cycle can also lead to STOP. Exact defaults, ranges and R/H behavior must be checked for the CPU, firmware and current manual.
What is an Allen-Bradley PLC task watchdog fault?
Current Rockwell Logix 5000 documentation defines a watchdog per task, starting when the task is initiated and ending after its scheduled programs complete, including interruption time. Exceeding it produces a major fault; exact fault-handler and repeated-fault behavior apply. Confirm the controller family, task type and current publication before changing the preset.
Practical next step
Create one timing worksheet for the affected controller. Put the exact task configuration beside current/min/max execution, a timeline of higher-priority work, triggering data size, communications/diagnostic state, watchdog reaction and the required process response. That sheet will show whether the repair belongs in code, scheduling, workload, network design, controller capacity or the threshold—and provides the acceptance evidence a simple reset cannot.
Sources, review scope, and limitations
Reviewed on 30 August 2026. The article intentionally compares several platforms to expose semantic differences; it does not establish a portable preset or recovery procedure. The exact target manuals, approved project, risk assessment and witnessed tests govern each installation.
- Rockwell Automation — Logix 5000 Controllers Tasks, Programs, and Routines, 1756-PM005M-EN-P (September 2025)
- Rockwell Automation — Studio 5000 Logix Designer task execution
- Rockwell Automation — Logix 5000 Controllers General Instructions, 1756-RM003Z-EN-P
- Rockwell Automation — ControlLogix 5590 high-availability watchdog time
- Rockwell Automation — set minimum standard-task watchdog values for high availability
- Rockwell Automation — GuardLogix safety task period and watchdog
- Rockwell Automation — GuardLogix system reaction time
- Siemens — S7-1500 cycle and response times function manual, November 2024
- Siemens — S7-1500 cycle time and maximum cycle time
- Siemens — S7-1500 CPU properties and time-error behavior
- CODESYS — task object and watchdog configuration
- CODESYS — ScriptTaskConfigObject watchdog fields
- Schneider Electric — Modicon M262 system and task watchdogs
- Schneider Electric — Modicon M262 task types and system processing
- Schneider Electric — Modicon M262 application error status codes
- Beckhoff — TwinCAT 3 task properties and watchdog cycles
- Beckhoff — The TwinCAT Project manual
- IEC — IEC 61131-3:2025 programmable-controller languages
- NIST — SP 800-82 Rev. 3, Guide to Operational Technology Security
- CISA — Industrial Control Systems advisories
- OSHA — Control of hazardous energy (lockout/tagout)
- OSHA — Electrical safety-related work practices
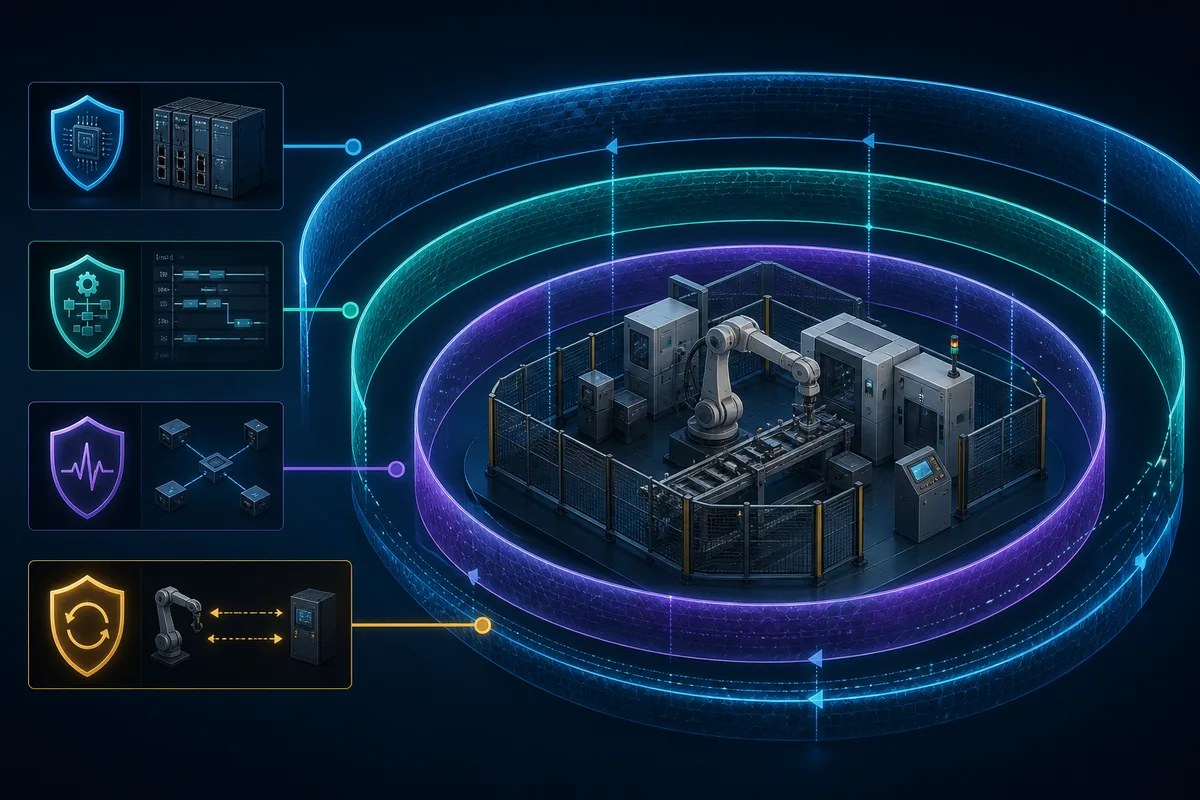
The six diagrams are original, brand-neutral teaching illustrations. They do not reproduce a vendor task monitor, safety calculation or output wiring and must not be used as commissioning drawings. Vendor and product names identify documented behavior only; PLC Programming IO is independent of those manufacturers.


