SCADA Architecture: Components, Networks and Diagrams
Design SCADA architecture from field devices to redundant servers, historians, operator clients, OT network zones, remote sites and bounded cloud integration.
SCADA architecture is the arrangement of field devices, PLCs or RTUs, communication paths, supervisory servers, historians, operator clients and external interfaces that lets people monitor and issue bounded commands to an industrial process. Local controllers should retain the control and safe-state behavior that must continue when a server, client or wide-area link is unavailable. The right architecture is therefore not simply a block diagram; it is a set of owned data, command, availability, security and recovery boundaries.
This guide answers the related questions people use when planning a system: What are the components of a basic SCADA architecture? How do field, supervisory and enterprise functions differ? When should servers be centralized, distributed, redundant or placed at the edge? How should polling, report-by-exception and publish/subscribe data cross the system? What belongs in a SCADA network diagram? How do you test failover, stale data, commands and recovery? It also separates architecture intent from the broader SCADA best-practices lifecycle, which remains a different task.
Basic SCADA architecture: the field-to-operator path
A basic SCADA architecture has six functional steps: field instruments and actuators; a local PLC or RTU; an industrial communication path; a supervisory data and alarm service; historical storage; and an HMI or operator client. The path begins with the process and ends with a human decision or an approved supervisory command. A sensor measures a physical condition. A PLC or RTU converts the signal, validates it and runs local logic. A communication service transfers selected values and events. A supervisory server maintains current state, alarm and event functions, and access to historical data. An operator client presents that information and sends authorized requests back through the server. External systems receive only the data and functions their interface contract permits.
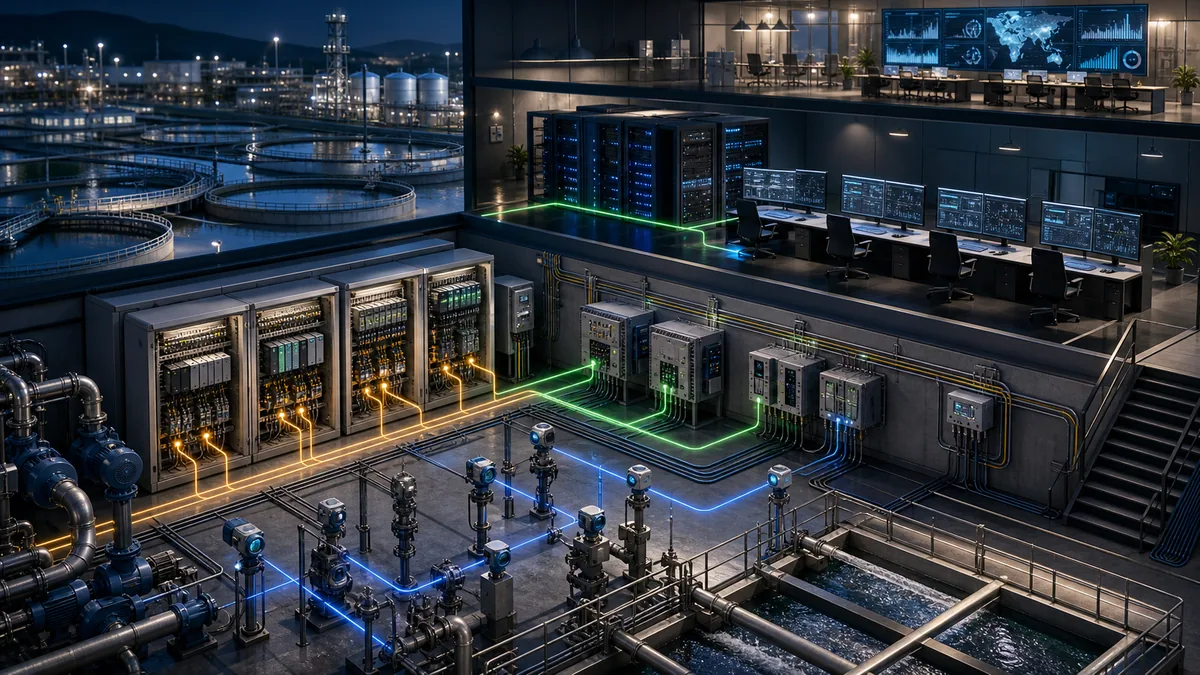
Six functional components
The exact product names differ, but six functions recur. Some small systems combine server, historian and client services on one machine. Large or regulated systems often separate them. Function is more useful than box count because it reveals what must continue when one box fails.
| Component | Primary responsibility | Must be defined explicitly | Typical failure evidence |
|---|---|---|---|
| field instruments and actuators | sense or influence the physical process | range, units, state, quality, fail position and calibration ownership | loop reading, device diagnostic, output feedback |
| PLC or RTU | acquire I/O, execute local logic and arbitrate commands | safe behavior, scan/update timing, local/remote authority and retained state | controller status, task trace, I/O quality, event log |
| communication path | transport values, events and commands | media, protocol role, addressing, timeout, retry and route diversity | port counters, radio metrics, protocol trace, route state |
| supervisory service | maintain current data, alarms, commands and user sessions | tag model, command validation, roles, capacity and restart behavior | service health, alarm/event log, session audit, queue depth |
| historian and reporting services | preserve time-series and event evidence | source timestamps, compression, retention, backfill and restore | gap report, ingestion queue, timestamp comparison, restore test |
| HMI and engineering clients | present state and provide authorized interaction | display ownership, navigation, privileges, session and degraded-mode behavior | client log, user audit, display diagnostics, command acknowledgment |
Control authority stays close to the process
SCADA is supervisory. A server can request a pump start, change an approved setpoint or select a mode, but the PLC or RTU should still evaluate permissives, interlocks, sequence state and output feedback. Do not make a wide-area link or cloud service part of a control loop unless the hazard, latency, availability and fallback requirements explicitly justify and validate that design.
The practical test is simple: disconnect the supervisory path in a controlled environment. Local control should enter the specified operating or safe state, stale supervisory data should be identifiable, unauthorized commands should remain impossible, and operators should receive a defined indication when visibility returns.
Functional layers, ISA-95 levels and security zones
“Layer” is overloaded in SCADA conversations. A functional layer describes what a service does. An ISA-95 level describes activities and integration boundaries. A security zone groups assets with common security requirements. A network segment is an implementation mechanism. They can inform one another, but they are not interchangeable labels.
A useful functional-layer model
| Functional layer | Included functions | Normal time horizon | Boundary question |
|---|---|---|---|
| process | equipment, energy and material being controlled | physical dynamics | what can harm people, equipment, environment or production? |
| sensing and actuation | instruments, drives, starters and final elements | milliseconds to seconds | how is physical state represented and proven? |
| local control | PLCs, RTUs, protection and local sequences | milliseconds to minutes | what continues without SCADA? |
| supervision | acquisition, current-state services, alarms, operator clients | sub-second to shifts | who may observe, acknowledge or request change? |
| operations information | historian, reporting, maintenance and production context | shifts to years | which timestamp, quality and definition makes data trustworthy? |
| external integration | MES, ERP, analytics, remote support and bounded cloud services | minutes to planning horizons | what information or action may cross the boundary? |
ISA-95 is an activity model, not a firewall recipe
The ISA-95 series organizes enterprise and manufacturing activities and the information exchanged among them. It is useful for stating who owns production schedules, equipment state, material context and business integration. It does not by itself prove that a particular VLAN, firewall rule or server placement is secure. Use the model to clarify responsibilities, then perform system-specific architecture and cybersecurity work.
Similarly, a Purdue-style drawing is not evidence of segmentation. Evidence includes the resolved asset inventory, physical and logical paths, firewall and switch configuration, permitted flows, identities, trust stores, remote-access path, monitoring coverage, backups and recovery results.
Centralized, distributed, hub-and-spoke and hybrid topologies
Topology should follow operating geography, loss-of-service consequences, bandwidth, latency, data ownership, support capability and recovery objectives. A fashionable topology is not automatically a suitable one.
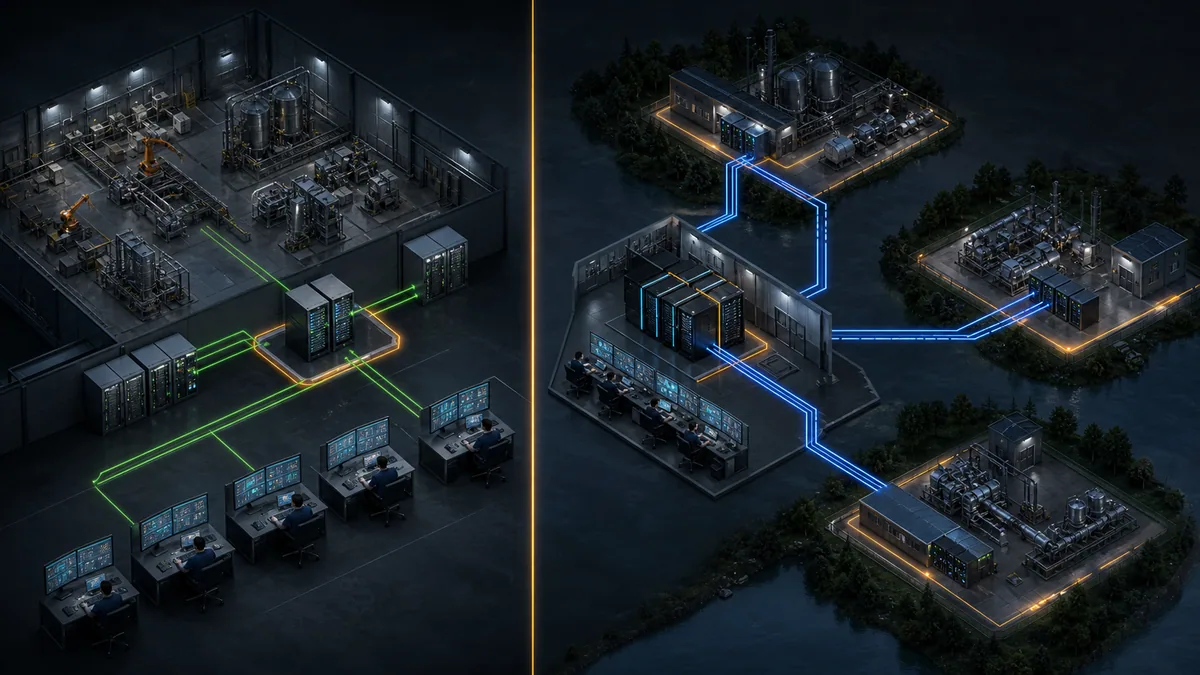
Topology comparison
| Topology | Strong fit | Principal advantage | Principal risk to engineer | Minimum acceptance case |
|---|---|---|---|---|
| single-site centralized | one bounded plant with reliable local infrastructure | simple ownership, backup and change control | concentrated server, power or network failure | isolate every single point and verify defined local behavior |
| redundant centralized | critical plant with one operations center | service continuity through planned or unplanned server loss | shared dependencies and split-brain behavior | fail active server, network, power and dependency separately |
| distributed | autonomous plants or field regions | local operation and fault containment | inconsistent configuration, identity and data semantics | sever WAN and reconcile queued data and commands after return |
| hub and spoke | many sites needing shared standards and central visibility | reusable central services with site autonomy | hub overload or excessive trust across spokes | lose hub, lose one spoke and deny unauthorized cross-site access |
| scale-out | high tag, client, historian or workload demand at one site | workloads can be separated by service | hidden coupling and ambiguous ownership | load-test each service plus dependency and recovery paths |
| hybrid edge/cloud | bounded telemetry, fleet analytics or remote reporting | elastic analysis without moving primary local control | Internet dependency, identity sprawl and unclear data residency | lose cloud/WAN, buffer locally, restore securely and reconcile once |
The Ignition system-architecture examples illustrate basic, scale-out, hub-and-spoke, IIoT, enterprise, redundant and cloud deployments for that platform. Treat vendor diagrams as implementation examples, not universal prescriptions. Product limits, licenses, failover behavior and security controls must be checked against the exact version being purchased.
Do not confuse distribution with redundancy
Multiple servers do not guarantee availability. They may share one hypervisor cluster, storage array, switch stack, directory service, time source or power path. Conversely, a distributed system may deliberately allow each site to operate independently without providing seamless central failover. State the required service and recovery result first; then trace every dependency capable of defeating it.
How data moves: polling, events and publish/subscribe
SCADA data flow is a contract between a source and consumer. The contract includes identifier, type, engineering unit, valid range, quality, source time, server time, update rule, deadband, timeout, stale behavior and command authority. A green connection icon does not prove that contract.
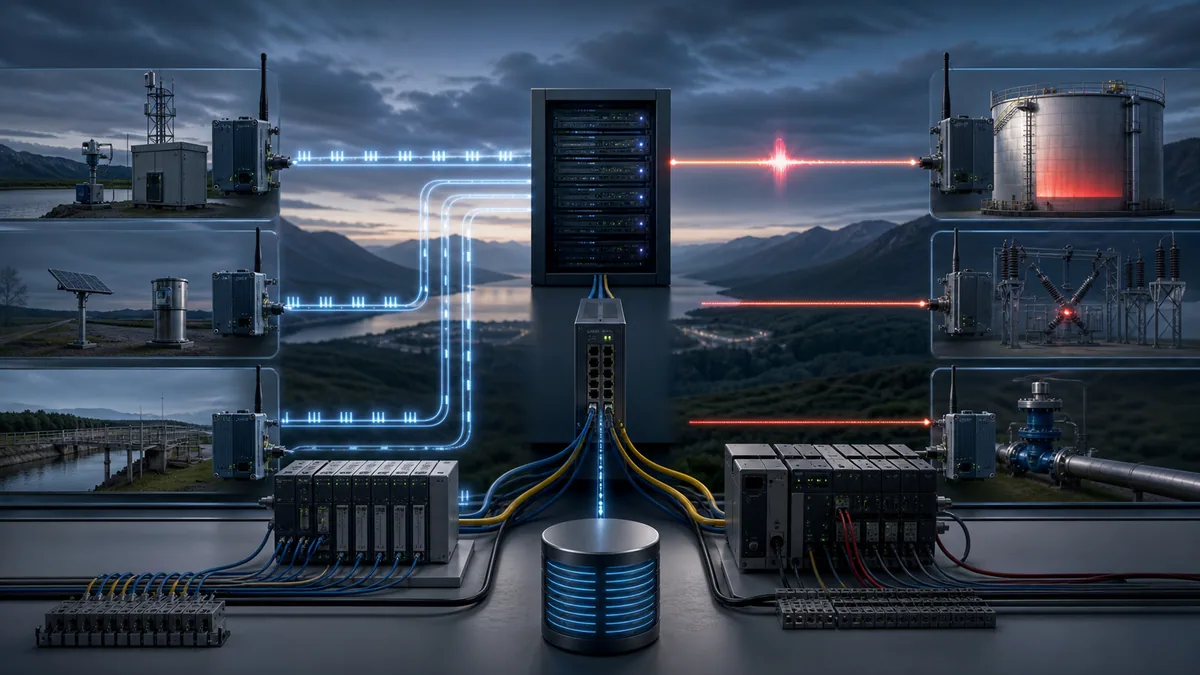
Acquisition-pattern tradeoffs
| Pattern | How it behaves | Useful when | Failure question | Required evidence |
|---|---|---|---|---|
| cyclic polling | master requests current values on a schedule | predictable inventories and stable links | can every point be refreshed within the stale-data limit under retries? | scan-group timing, request/response trace, link load and stale alarm |
| report by exception | field device sends significant changes or events | constrained links and event-oriented telemetry | what happens when reports or acknowledgments are lost? | event buffer, sequence/time handling, integrity poll and backfill test |
| unsolicited event plus integrity poll | events are pushed while periodic reads reconcile state | remote utility systems needing events and eventual completeness | can missed events and current state be distinguished? | event classes, time synchronization, restart and reconciliation record |
| subscription | server publishes changes to subscribed consumers | structured platform integration | how are sampling, publishing, queueing and reconnect defined? | subscription settings, quality/time, queue overflow and reconnect trace |
| brokered publish/subscribe | publishers and consumers exchange through a broker | multi-site telemetry and decoupled consumers | who owns topic, state, identity, retention and offline behavior? | namespace contract, birth/death or session state, ACL and store-forward test |
DNP3, Modbus, OPC UA and Eclipse Sparkplug illustrate different communication and information patterns. A protocol name alone does not define performance. Exact device roles, profiles, objects or registers, queue limits, timestamps, retry settings, security options and vendor implementation determine observed behavior.
Commands need a state model
An operator command is not merely a Boolean written across a network. Define select/execute or request/acknowledge behavior where appropriate, authorization, interlocks, command ownership, expiry, duplicate handling, feedback, timeout, alarm and recovery. Test delayed, duplicated, rejected and stale commands. The controller must not keep acting on a supervisory request after the request has expired or the operating context has changed.
SCADA software architecture and data ownership
SCADA software can be one executable on one machine or a set of acquisition, alarm, historian, visualization, identity, reporting and integration services. Separate services only when the separation provides a measurable availability, performance, security, lifecycle or organizational advantage.
Service boundaries and dependencies
| Service | Inputs and outputs | Capacity measure | Hidden dependency to expose |
|---|---|---|---|
| device communication | protocol sessions to normalized tags/events | devices, connections, polls, bytes and retries | driver version, certificate, route, name service and time |
| real-time tag service | current values, quality, time and derived calculations | active tags, update rate and expression workload | controller namespace and gateway cache behavior |
| alarm/event service | conditions, states, acknowledgments and audit | events per second, active alarms and retention | time source, user identity, shelving/suppression rules |
| historian | timestamped samples and backfill | values per second, compression, retention and query load | database/storage latency, source-time rules and disk lifecycle |
| visualization | sessions, displays, trends and commands | concurrent clients, display complexity and query windows | identity provider, browser/runtime version and server affinity |
| integration | bounded exchanges with MES, reporting, analytics or cloud | messages, payload size, latency and queue depth | schema ownership, broker/API availability and retry semantics |
One canonical tag and event contract
Define a canonical name and meaning once, then map platform-specific identifiers to it. The contract should distinguish raw I/O, conditioned engineering value, command request, controller output, physical feedback, alarm state and calculated production context. Never infer data validity solely from a plausible number. Carry quality, source timestamp and freshness into displays, history and downstream interfaces.
A practical tag-map record includes source controller and address, SCADA tag, type, unit, scale, expected rate, deadband, quality rules, history rule, alarm ownership, write privilege, command handshake, consumer list and test evidence. That record is more useful for commissioning and migration than a screenshot of a tag browser.
Capacity, redundancy and recovery objectives
Do not size a SCADA server from tag count alone. Acquisition traffic, protocol grouping, expression tags, alarm bursts, concurrent clients, historical ingestion, trend query windows, reports, scripts, redundancy synchronization, antivirus, backup and virtualization contention all matter. Vendor benchmarks are starting points; a representative load test is acceptance evidence.
Define service objectives first
| Objective | Example requirement format | What to measure |
|---|---|---|
| data freshness | critical status visible within X seconds for Y percentile under normal load | source time to display time with quality |
| command completion | authorized command acknowledged or timed out within X seconds | request, acceptance, controller action and feedback timestamps |
| server recovery | supervisory service restored within X minutes after one defined failure | detection, promotion/restart, client recovery and data continuity |
| historical continuity | no unmarked gap longer than X seconds; backfill within Y minutes | source/server time, queue depth, missing intervals and duplicates |
| alarm delivery | priority event annunciated within X seconds and retained with state transitions | condition, active, acknowledged, returned-normal and audit times |
| degraded operation | local control continues for X hours without WAN or central service | controller state, local HMI, buffer capacity and reconciliation |
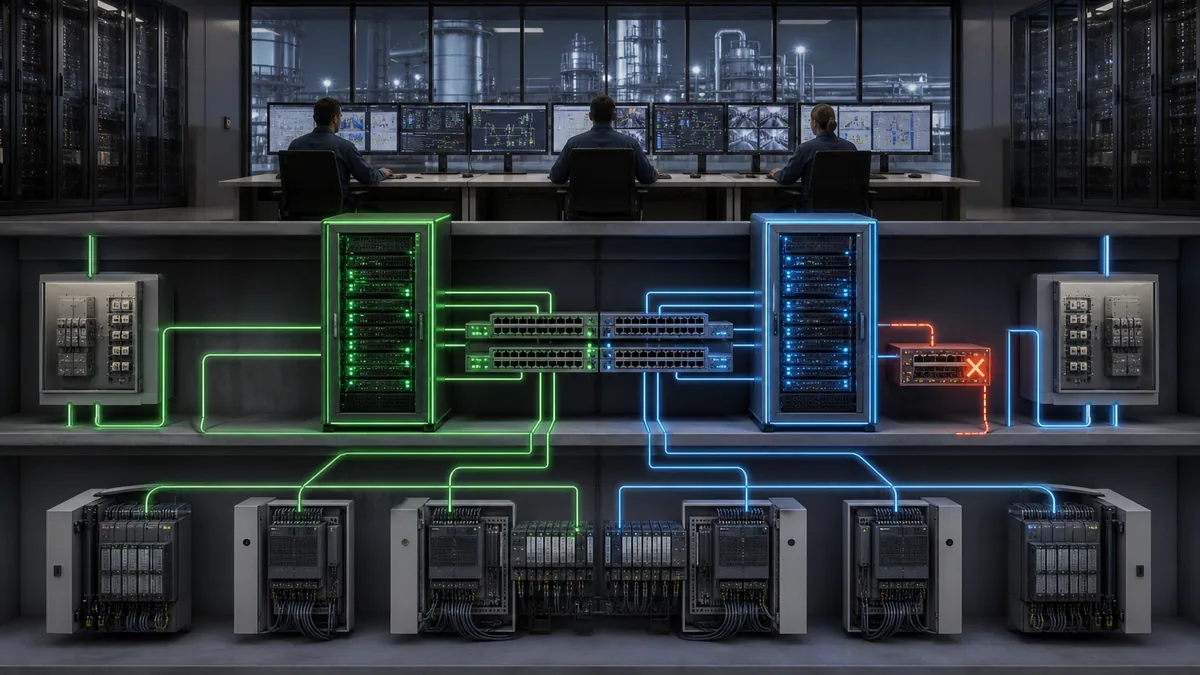
Failover is a sequence, not a checkbox
Document how failure is detected, how an active role is elected, how split brain is prevented, how field connections move, how clients reconnect, what happens to commands in flight, how alarm and historian state reconcile, and how the repaired node rejoins. Test one failure at a time and simultaneous failures justified by the risk analysis. Preserve before/during/after logs from both nodes and the field endpoint.
High availability is not the same as backup, and backup is not disaster recovery. Redundancy can preserve a running service through a component failure. A controlled offline backup can recover from corrupted configuration or malicious change. Disaster recovery restores defined services after loss of a site or shared infrastructure. Each needs a distinct objective and proof test.
SCADA network architecture and defense in depth
A SCADA network diagram should identify assets, trust boundaries, conduits, protocols, directions, identities, remote access, shared dependencies and recovery services. “OT VLAN” and “firewall” boxes without allowed-flow detail are not sufficient.
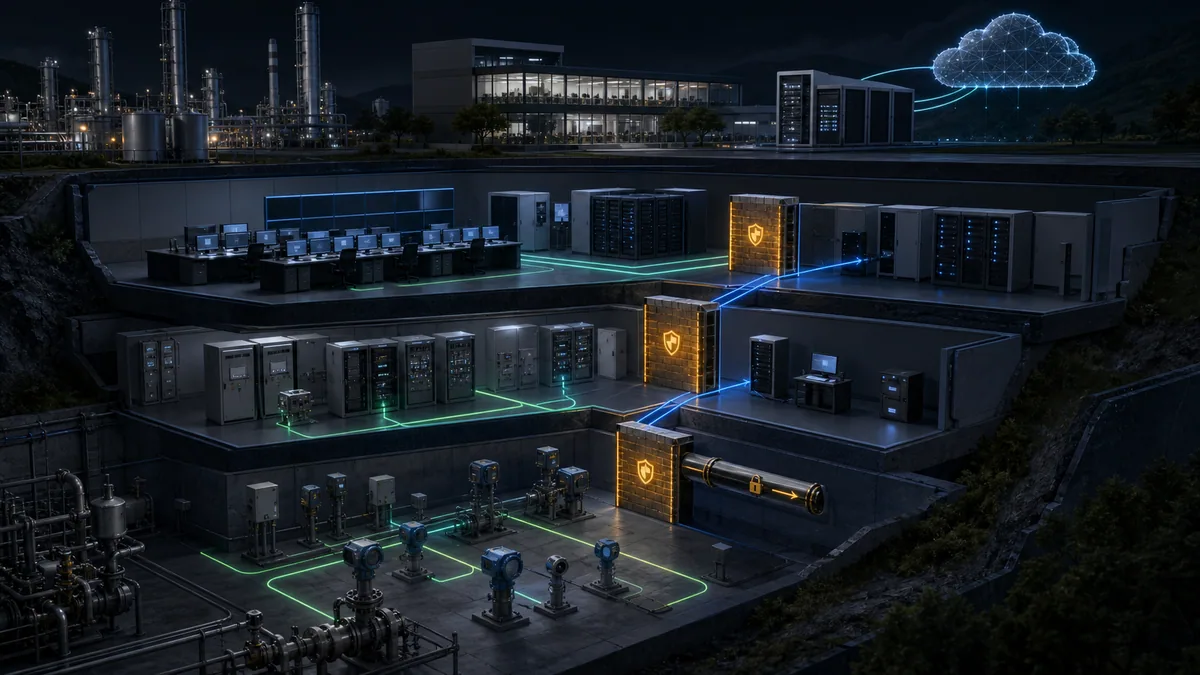
Turn every conduit into an allowlist
| Conduit | Initiator | Destination service | Data or action | Security and operational evidence |
|---|---|---|---|---|
| controller to acquisition | named PLC/RTU or server, per protocol role | exact driver endpoint | approved tags, events and bounded commands | address/profile, permit rule, identity where supported, timeout and trace |
| operator client to SCADA | managed client | visualization/session service | display, acknowledgment and role-bound command | user/device identity, encrypted session, role and audit event |
| SCADA to historian | acquisition or history service | defined storage endpoint | timestamped value, quality and event record | service identity, queue, retention, integrity and restore proof |
| OT to DMZ | named publisher or replica | relay, broker or replica service | one approved dataset and direction | dual boundary rules, schema, logging and loss/recovery behavior |
| remote support | managed access service | approved administration target | time-bound maintenance session | MFA, approval, recording/logging, least privilege and termination |
| DMZ to enterprise/cloud | relay or API client | named external service | bounded report or telemetry payload | egress allowlist, credentials, encryption, data classification and retry limit |
NIST SP 800-82 Rev. 3 provides OT security guidance that accounts for performance, reliability and safety constraints. The ISA/IEC 62443 series addresses processes and requirements for industrial automation and control-system security; the public ISA-62443-3-2 preview explicitly includes partitioning a system under consideration into zones and conduits and assessing their risk. Apply these through a site-specific program rather than copying a generic diagram.
Identity and recovery are architecture concerns
Document human, service and device identities; certificate and secret lifecycle; time synchronization; logging; configuration backups; tested restoration; vulnerability handling; vendor access; removable media; and incident isolation. Segmentation reduces paths but cannot repair shared credentials, unmanaged endpoints, untested backups or uncontrolled engineering access.
Hybrid edge, IoT and cloud integration
Cloud and IoT services can provide fleet analytics, long-term storage, remote reporting or model workloads. They should not silently become required for local process control. Place an explicit edge or DMZ boundary between control assets and external services, minimize outbound data, define identity and schema, and specify store-and-forward and deletion behavior.
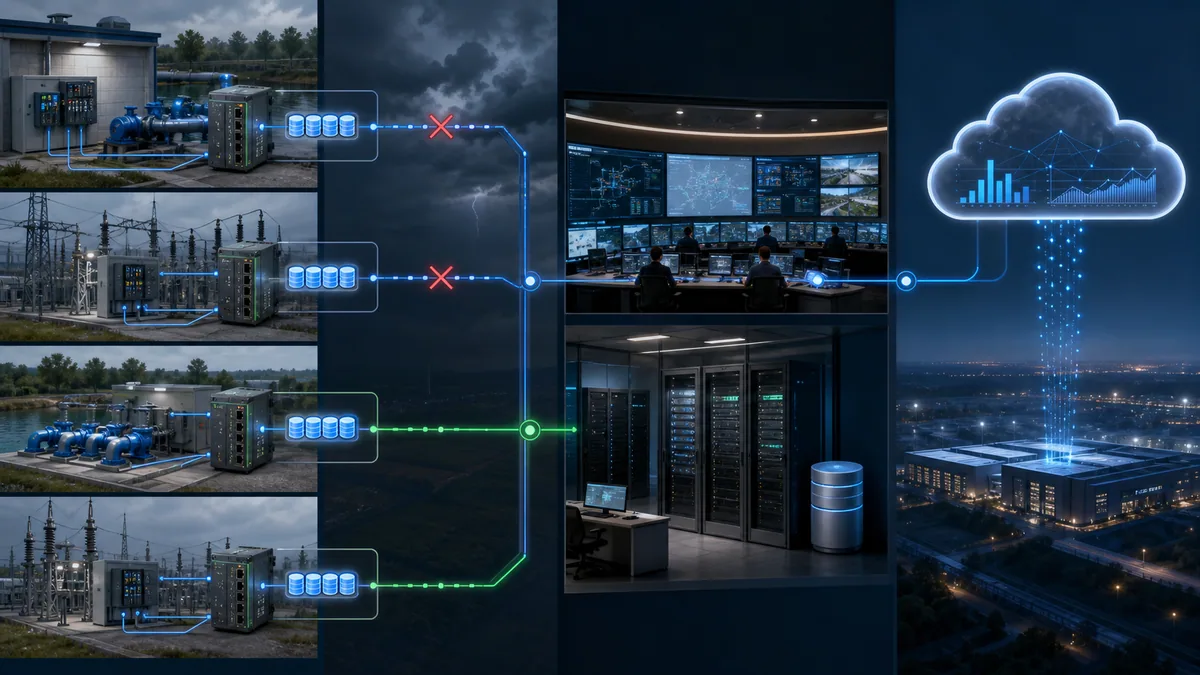
Keep the cloud boundary testable
Before approval, answer: Which exact data leaves the site? Who owns its meaning and retention? Can the edge detect stale source data? What happens when the broker, identity provider, DNS, time service or Internet route fails? Can queued data overwhelm a returning link? Can an external service write back, and if so, through which authorization and controller-side acceptance state machine? The separate Industrial IoT for PLC systems guide covers PLC-to-edge data contracts in more depth.
The query “SCADA architecture in IoT” currently produces a materially different result set from the broad architecture query. It therefore remains a separate content-validation and ownership task rather than being declared a synonym here. This section defines the boundary without pretending to satisfy every IoT implementation question.
A requirements-to-acceptance design workflow
Architecture work should produce decisions and test cases, not only a polished drawing. Start from process and operator needs, identify failure consequences, allocate functions, define data and command contracts, select topology and products, then verify the result under normal, degraded and recovery states.
Design deliverables
- Operating narratives: who observes and commands each process state, including manual, local, remote, maintenance and degraded modes.
- Asset and function inventory: exact component, role, owner, version, location, criticality and lifecycle state.
- Data and command map: source, consumer, meaning, quality, time, rate, stale rule, write authority and handshake.
- Network and trust diagram: physical/logical path, zone, conduit, protocol, direction, identity, boundary control and monitoring.
- Capacity model: normal, peak, failure and growth loads for communications, tags, alarms, history, clients, storage and integrations.
- Availability model: single points, shared dependencies, detection, failover, degraded operation and recovery objectives.
- Security architecture: identities, least privilege, segmentation, remote access, logging, backup and incident containment.
- Acceptance matrix: stimulus, expected state, evidence, owner, result and corrective action.
Commission normal, failure and recovery states
| Acceptance area | Controlled stimulus | Required observation |
|---|---|---|
| value contract | inject minimum, normal, maximum, invalid and bad-quality values | type, unit, scale, quality and timestamps agree from source through display/history |
| command contract | issue valid, unauthorized, expired, duplicated and interlock-blocked requests | authorization, controller acceptance, feedback, timeout and audit match the state model |
| communications | add representative load, delay, loss and route failure within approved test limits | stale detection, retry, queue, alarm and local behavior meet requirements |
| server service | stop one service or active node | failure detection, promotion/restart, client state and in-flight work are deterministic |
| historian | interrupt ingestion and restore it | gaps are visible, backfill/reconciliation is bounded and duplicates are handled |
| identity and trust | expire/revoke a test credential or deny a role | connection or action fails clearly without bypassing required control |
| backup and restore | restore the released configuration to representative infrastructure | versions, secrets, data, clients and field paths return through a documented procedure |
| disaster/degraded mode | isolate WAN, central site or external service | local control continues as specified and recovery does not replay unsafe commands |
Preserve the test environment, input, timestamp, expected result, observed result, logs and final configuration identifier. “Passed FAT” without reproducible evidence is not a useful baseline for a later fault or upgrade.
Troubleshooting the architecture by boundaries
Start with scope and time: what stopped, what continued, which users or sites were affected, and what changed? Preserve logs, counters and current role states before restarting components. Then move from the last proven boundary toward the fault.
Evidence ladder
- Verify process and local-controller state, including whether control is still safe and autonomous.
- Verify power, physical links, radio or carrier status, and interface counters at both ends.
- Verify addressing, routing, name/time services, certificates and the intended protocol role.
- Verify acquisition session, queue, scan group or subscription state.
- Compare tag identifier, type, unit, quality and timestamps at source, server, historian and client.
- Verify active/standby role, shared dependencies and recent failover or deployment events.
- Verify user identity, authorization and command-state transitions.
- Make one reversible change, record the result and confirm recovery across every affected consumer.
The PLC communication troubleshooting guide provides a protocol-focused evidence path. For implementation detail, use the vendor-neutral PLC–HMI communication guide, the Delta PLC-to-HMI communication guide, the SCADA program workflow, or the SCADA architecture in IoT guide when edge gateways, MQTT and bounded cloud telemetry are the actual task. Use vendor diagnostics and approved packet or radio tools for the installed system; a generic browser example cannot prove physical media, production timing or vendor failover.
Official references and claim boundaries
- ANSI/ISA-112.00.01-2025 establishes current SCADA lifecycle, diagram and terminology context. ISA describes Part 1 as a vendor-neutral framework; later parts should not be assumed published until verified.
- ISA's 2026 publication announcement states that Part 1 supports design, upgrade, operation and long-term management.
- ISA-95 addresses enterprise-control integration activities and information boundaries.
- NIST SP 800-82 Rev. 3 provides OT security guidance and typical topologies while accounting for operational constraints.
- ISA/IEC 62443 is the industrial automation and control-system cybersecurity standards family.
- CISA ICS recommended practices provide government resources on industrial-control vulnerabilities and mitigations.
- Ignition's current architecture manual shows product-specific basic, scale-out, distributed, redundant and cloud examples.
- The OPC Foundation OPC UA overview and Eclipse Sparkplug specification define relevant structured and brokered information patterns.
- The DNP Users Group overview and Modbus specifications are primary starting points for two common acquisition families.
These sources define frameworks and technologies; they do not certify a site design. Exact performance, redundancy, security and compatibility claims require the purchased product documentation, licenses, firmware/software versions, representative load, approved network configuration and recorded acceptance results.
Frequently asked questions
What is SCADA architecture?
SCADA architecture is the arrangement of field devices, PLCs or RTUs, networks, supervisory services, historians, operator clients and external interfaces used for supervisory control and data acquisition. A complete architecture also defines data meaning, command authority, availability, security and recovery boundaries—not only where boxes appear on a diagram.
What are the main components of a SCADA system?
The recurring functions are field sensing and actuation, local PLC or RTU control, communications, supervisory acquisition and alarm services, historical storage, and operator or engineering clients. Products may combine several functions, but each function still needs an owner, interface, capacity limit and failure response.
What is a basic SCADA architecture?
A basic architecture has instruments connected to a PLC or RTU, a communication path to one supervisory server, a historian or database, and one or more operator clients. Even a small system should keep required local control in the controller, identify stale data, restrict commands and have a tested backup and restore path.
What belongs in a SCADA architecture diagram?
Show exact assets and roles, physical and logical connections, zones and conduits, protocols and direction, primary/standby paths, shared dependencies, remote access, time and identity services, external interfaces, and ownership. Maintain separate logical, network, data-flow and deployment views when one drawing would become ambiguous.
What is the difference between centralized and distributed SCADA?
Centralized SCADA concentrates supervisory services at one main location. Distributed SCADA places acquisition or supervisory capability at multiple sites or service nodes. Distribution can improve autonomy and fault containment, but it also adds configuration, identity, data-reconciliation and support responsibilities. Neither topology guarantees redundancy by itself.
Is SCADA the same as HMI?
No. An HMI is the human-facing display and interaction function. SCADA includes acquisition, current-state services, alarms, history, communications and supervisory command across a wider system. A local panel HMI may operate without a SCADA server, and a SCADA platform may serve many HMI clients.
What is the difference between an RTU and a PLC in SCADA?
RTUs are commonly optimized for remote telemetry, constrained or intermittent links, time-stamped events and environmental or power constraints. PLCs are commonly optimized for deterministic machine or plant control. Modern products overlap, so select the exact device from control timing, I/O, protocol, power, environment, buffer, security, lifecycle and support requirements.
How should SCADA redundancy be tested?
Fail one defined dependency at a time: active server, service, network path, switch, power source, database, identity or time service. Record detection, role transition, split-brain prevention, client and field reconnection, alarm/history continuity, commands in flight and recovery of the repaired node. Then test justified combined failures from the risk analysis.
Can a SCADA system use cloud services?
Yes, for bounded uses such as fleet analytics, reporting, remote data access or elastic workloads. Keep required local control independent, define an edge or DMZ boundary, minimize permitted data and actions, manage identity and retention, and test Internet, broker, DNS, time and cloud-service loss plus safe reconciliation.
Does the Purdue model secure a SCADA network?
No. A Purdue-style or ISA-95-derived hierarchy helps describe activities and boundaries, but a diagram does not enforce them. Security requires resolved assets, risk assessment, zones and conduits, allowlisted flows, identities, monitoring, controlled remote access, configuration management, backups, recovery and verification on the installed system.
Use the diagram to drive evidence
A good SCADA architecture makes control authority, data ownership, service dependencies and failure behavior visible. Convert every connection into a data or command contract, every redundancy claim into a failure test, every boundary into an allowlist, and every recovery objective into a rehearsed procedure. That is how a diagram becomes an operable system rather than presentation art.
Ownership disclosure: PLC Programming IO operates PLC Simulation Software. Its browser lab can help rehearse PLC states, tag contracts, request/feedback handshakes, stale-data handling and fault evidence. It does not emulate every SCADA platform, vendor driver, radio path, server cluster or security appliance, and it cannot prove production timing or installed-system safety.


