How to Read a Pump Curve: Head, Flow & Efficiency
Read a centrifugal pump curve by finding the system-curve intersection, then check efficiency, power, NPSH, operating range and control behaviour.
A pump curve plots the head a pump can produce at different flow rates for a stated speed and impeller. The actual duty point is where that pump curve intersects the system curve. After finding the intersection, verify that it lies in the allowable operating range and check efficiency, absorbed power, NPSH required and motor margin.
Download the pump duty-point and commissioning worksheet (CSV)
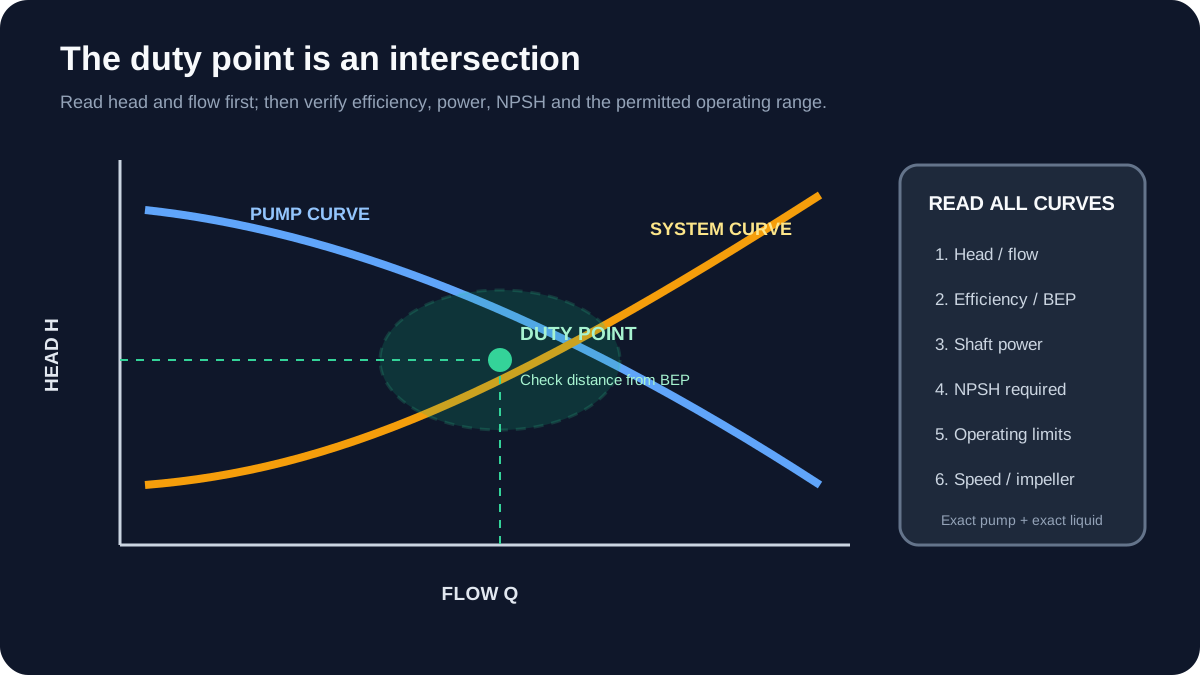
Pump-curve reading order
- Confirm the curve matches the exact pump, impeller diameter, speed, liquid and units.
- Find the required flow on the horizontal axis.
- Move upward to the pump curve and read head on the vertical axis.
- Find the actual pump/system intersection, not only the design marker.
- Check efficiency and distance from best efficiency point (BEP).
- Check absorbed power across the expected range.
- Check NPSH required against NPSH available with project margin.
- Verify minimum/maximum operating limits and manufacturer notes.
Head is not pressure
Pump head expresses energy per unit weight of liquid and is commonly shown in metres or feet of liquid. Pressure depends on liquid density:
Pressure = density × gravity × head
For water near ordinary conditions, 10 m of head is approximately 98.1 kPa. The same head with a different-density liquid produces a different pressure.
Use consistent datum, density and units. A discharge pressure gauge alone does not give total dynamic head unless suction conditions, velocity and elevation are accounted for.
The system curve
A simplified system head requirement is:
Hsystem = Hstatic + K × Q²
Where:
Hstaticis the static elevation/pressure component;K × Q²represents friction losses;Qis flow.
As flow increases, friction head generally rises approximately with the square of flow for a fixed turbulent-flow system. Closing a throttling valve increases system resistance and moves the operating point left. Increasing pump speed changes the pump curve.
The U.S. Department of Energy's MEASUR tools include pump-system assessments and a system-curve tool for plotting static head and an operating point.
Worked duty-point example
Assume a water system needs approximately 80 m³/h. At that flow:
- pump curve head: 34 m;
- system required head: 34 m;
- pump efficiency: 76%;
- absorbed shaft power from the manufacturer's curve: 9.2 kW;
- NPSH required: 2.8 m;
- calculated worst-case NPSH available: 4.5 m.
The 80 m³/h, 34 m intersection is the predicted duty point. The NPSH availability difference is:
NPSH margin = 4.5 m − 2.8 m = 1.7 m
That subtraction is not, by itself, acceptance. Apply the project/manufacturer's required margin and account for temperature, atmospheric pressure, suction losses, fouling, level and uncertainty.
Now check:
- Is the duty point within the manufacturer's preferred operating range?
- Is 76% near the listed BEP for this impeller?
- Can the motor handle absorbed power across all credible operating points?
- Does the process ever move to lower tank level or higher fluid temperature?
- Is minimum continuous flow protected?
Live mini-lab
Try it: press START, then STOP
A stop-dominant seal-in rung: START latches the motor output through its own contact, and STOP breaks the circuit.
Watch the output lamp: it stays on after START until you press STOP.
Free to start · runs in your browserOpens plcsimulationsoftware.com — same team
Best efficiency point
BEP is the point of maximum hydraulic efficiency on a stated pump curve. Operating far from BEP can increase recirculation, vibration, radial load, seal/bearing stress and energy use. The acceptable operating region comes from the manufacturer and applicable design standard—not from a universal percentage copied between pumps.
For control, trend the actual operating range instead of validating one commissioning point. A pump may be well selected at design flow but spend most of its life throttled at low flow.
Power curve and motor sizing
Read the power curve across the full credible flow range. Some pumps draw increasing power toward runout; others behave differently. Include:
- liquid density and viscosity;
- maximum impeller/speed under consideration;
- service factor and site standard;
- VFD and motor efficiency;
- ambient temperature and altitude;
- starting/bypass method where relevant.
Do not size the motor from hydraulic power alone:
Hydraulic power = density × gravity × flow × head
The motor must supply shaft/input power after hydraulic and mechanical losses, with the required design margin.
NPSH required and available
NPSH required (NPSHr) comes from the pump test/curve under stated conditions. NPSH available (NPSHa) comes from the system.
NPSHa is affected by:
- atmospheric or vessel pressure;
- liquid vapour pressure at temperature;
- suction static head or lift;
- suction-pipe friction and fittings;
- strainer fouling;
- tank level;
- acceleration or transient conditions.
If NPSHa is inadequate, cavitation, noise, vibration, damage and loss of performance can result. A PLC cannot solve an inadequate suction design by suppressing the alarm.
How speed changes the curve
For a geometrically unchanged centrifugal pump in an appropriate range, the affinity laws give useful first estimates:
Q₂ / Q₁ ≈ N₂ / N₁
H₂ / H₁ ≈ (N₂ / N₁)²
P₂ / P₁ ≈ (N₂ / N₁)³
If speed falls from 100% to 80%, the first estimate is:
- flow: 80%;
- head: 64%;
- power: 51.2%.
Real system behaviour depends on the system curve, pump efficiency and equipment limits. Use manufacturer curves/software for selection; use affinity laws for sense-checking and control reasoning.
Use the pump affinity-law calculator to compare multiple speed scenarios and export the estimates. It deliberately labels the result as theoretical because the installed system curve, efficiency, minimum flow, motor/drive limits, and control strategy still govern the real operating point.
PLC/VFD control implications
Constant-pressure control
A pressure PID changes speed to maintain a discharge or remote setpoint. Include:
- minimum speed/flow;
- sleep and wake thresholds with hysteresis;
- acceleration/deceleration constraints;
- sensor-failure response;
- high-pressure trip independent of ordinary control where required;
- duty/standby rotation;
- check-valve and no-flow detection.
Tank-level control
Level may set the speed or stage pumps. Slow process dynamics require a different tuning approach from discharge-pressure control. Prevent cycling with state logic, minimum run/off time and well-defined lead/lag transitions.
Parallel pumps
Parallel pumps do not simply double flow. Their combined pump curve intersects the same system curve at a new point. Stage a second pump from measured inability to meet demand, efficiency objectives and stable hysteresis—not a single high PID-output sample.
Field data needed to validate the curve
- suction and discharge pressure at known elevations;
- flow from a verified instrument or test;
- speed/frequency;
- motor power/current and voltage;
- valve positions;
- tank levels and liquid temperature;
- pump/impeller identity;
- vibration and unusual noise;
- strainer/filter differential pressure.
Correct gauge elevations and convert the readings to common head units before comparing them with the curve.
Troubleshooting from the curve
| Observed point | Possible causes to investigate |
|---|---|
| Low flow, higher head | throttled valve, obstruction, system resistance higher than design |
| High flow, lower head | system resistance lower than design, runout risk |
| Low flow and low head | wrong rotation, low speed, worn/damaged impeller, air/gas, suction problem |
| Unstable point | control hunting, air entrainment, check-valve interaction, parallel-pump instability |
| Correct head/flow but high power | density/viscosity, mechanical condition, instrument error, motor issue |
| Noise/vibration with low suction margin | cavitation or suction recirculation investigation |
Commissioning checklist
- Curve revision matches pump, impeller and speed.
- Units and liquid properties are confirmed.
- System curve and design duty are documented.
- Power and motor margin are checked over the operating range.
- NPSHa is calculated for worst credible conditions.
- Minimum flow and operating-region limits are implemented.
- Pressure, flow, speed and power readings are recorded.
- PID, sleep/wake and staging transitions are tested.
- Alarms have operator actions, not only thresholds.
Primary references
- U.S. Department of Energy, Pump systems resources.
- U.S. Department of Energy, MEASUR industrial assessment tools.
- Hydraulic Institute, Pump Systems Certification body of knowledge appendix.
Related guides
Now run it · free to start
Tune a PID loop against a live process model
Change the setpoint and loop terms, then measure overshoot, settling time and error in a browser PID lab. Free to start, nothing to install.
Ownership disclosure: PLC Programming IO and PLC Simulation Software are operated by the same publisher.


