Pressure, Flow and Level Measurement for PLC Systems
Select, integrate, scale, commission and troubleshoot industrial pressure, flow and level measurements from the process through the transmitter and PLC to a verified control decision.
Review status: Editorially reviewed against current official BIPM SI and NIST metrological-traceability guidance, IEC 62828-1:2026 transmitter evaluation scope, ISO 5167-1:2022 differential-pressure flow scope, current FieldComm HART status documentation, official Emerson pressure/magnetic-flow manuals, Siemens radar installation guidance and official OSHA hazardous-energy requirements; instrument suitability, accuracy, uncertainty, pressure boundaries, wetted materials, installation, ranges, diagnostic limits, calibration, overfill or safety independence and acceptance remain process-, device-, standard-, jurisdiction- and site-specific
Direct answer
Pressure, flow and level measurement in a PLC system begins with a defined measurand and ends with a verified decision. The process creates a physical condition; a sensing principle and installation respond to it; a transmitter converts the response into an analog, pulse or digital signal with configuration and status; the PLC input represents that signal as raw data plus quality; scaling and validation create an engineering-unit value; control, alarming, display or totalization consumes it; and independent process evidence confirms that the result is credible.
Select a pressure instrument only after defining gauge, absolute or differential reference, normal and upset range, overpressure/vacuum, dynamics, media, temperature, connection and installation effects. Select a flow instrument only after defining mass versus volumetric flow, actual versus normalized conditions, fluid phase and properties, pipe state and geometry, flow profile, range/turndown, pressure loss, bidirectionality, totalization and required uncertainty. Select a level instrument only after defining continuous level, point detection, interface, innage/ullage or derived volume/mass, plus vessel geometry, density, dielectric behavior, vapor, foam, agitation, pressure, temperature, nozzles and overfill independence.
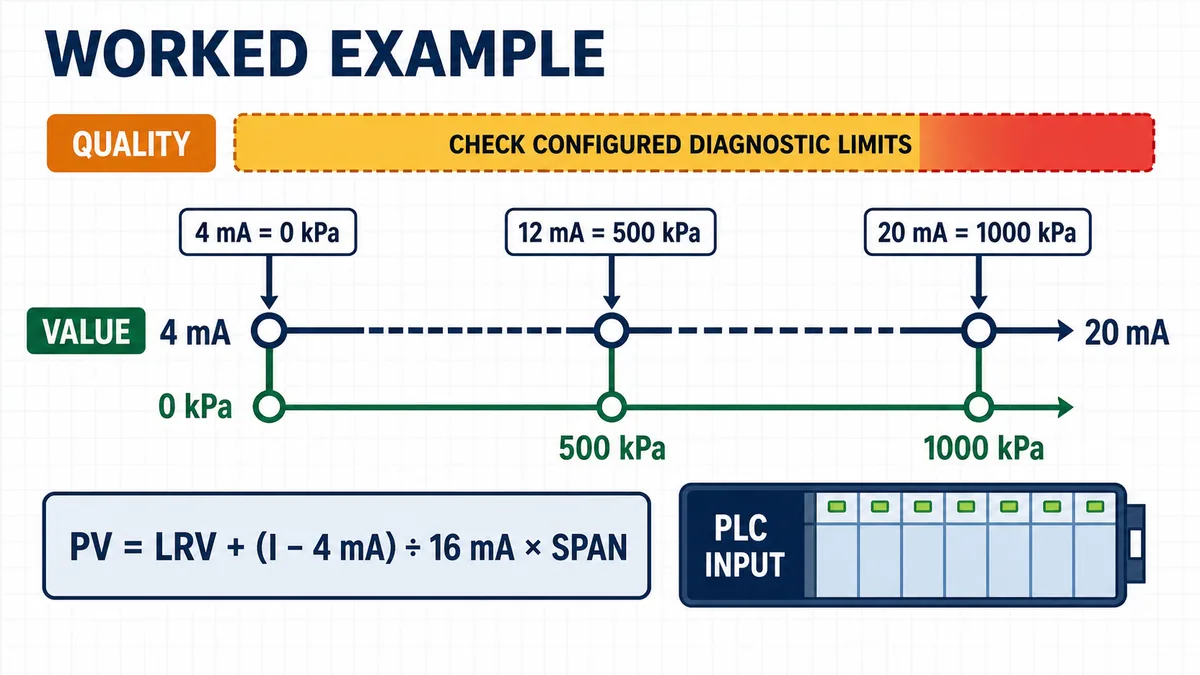
For a linear 4–20 mA example configured as 0–1000 kPa, 12 mA represents 500 kPa: PV = LRV + ((I − 4 mA) / 16 mA) × span. The same equation does not prove the process is at 500 kPa. Confirm transmitter range and units, input range, loop health, raw/current evidence, device/channel status, scaling ownership, data age and an appropriate process reference. Do not hard-code generic fault-current limits; use the exact transmitter and input configuration.
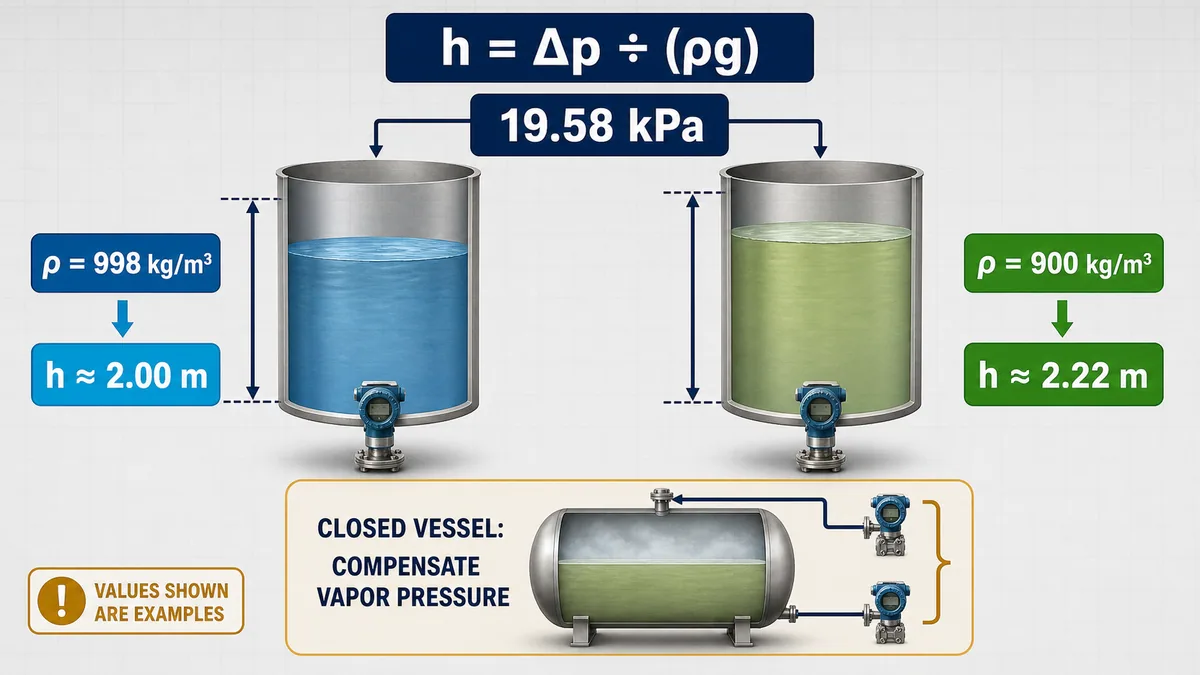
Pressure can infer level through h = Δp / (ρg) only when pressure reference, density, taps/seals and process conditions support the model. Differential pressure can infer flow through a square-root relation only under the applicable primary-element and fluid model; perform square-root extraction exactly once. Level becomes volume only through the correct vessel geometry or a controlled strapping table. Carry units, assumptions, data quality and revision identity with every conversion.
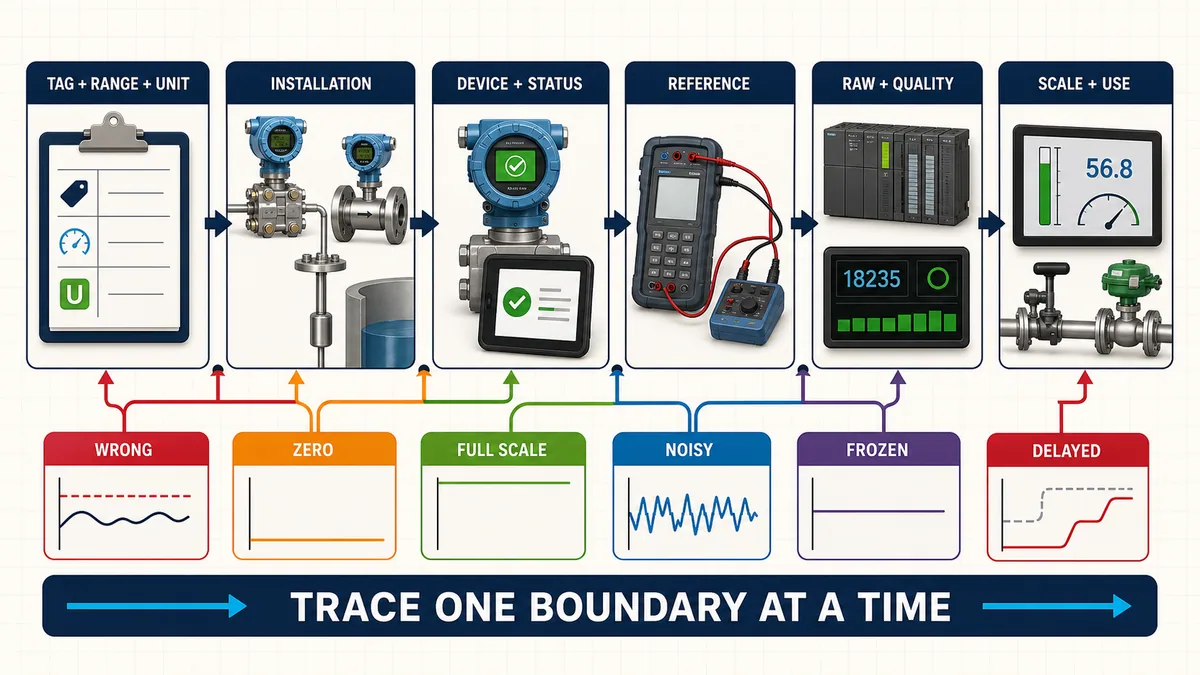
Troubleshoot one boundary at a time: process, sensing principle/primary element, installation, transmitter, field signal, PLC channel, raw/status data, scaling/validation, consumer and independent response. A plausible number can still be wrong; a frozen value can remain within range; and a successful signal simulation proves only the downstream path that was actually exercised.
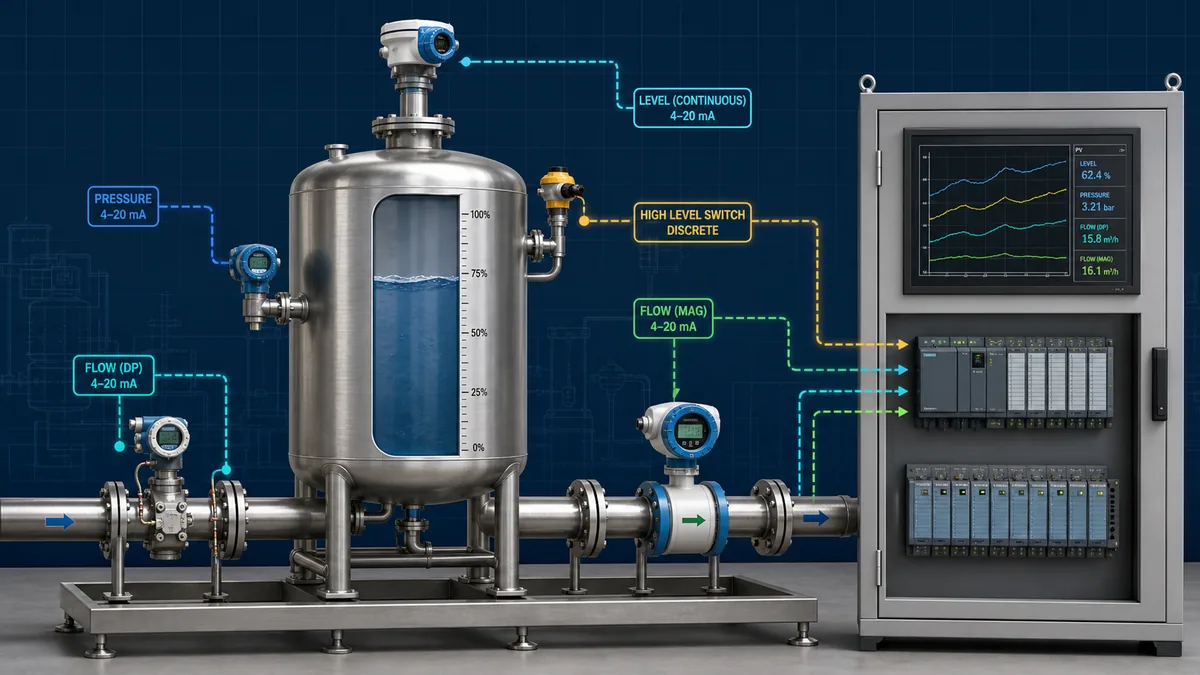
Define the measurand and the decision first
Name what is being measured, not only the instrument tag
A measurement specification should state the quantity intended to be measured, the process state and reference conditions that define it, the required range and units, and the decision it supports. “PT-101, 0–10 bar” is incomplete. Is it absolute pressure, pressure relative to local atmosphere or differential pressure between two points? Is the value used for indication, closed-loop control, equipment protection, material balance, product quality, custody transfer or a safety function? What normal, startup, cleaning, empty, blocked and upset states must be distinguishable?
The BIPM SI Brochure is the authoritative description of the International System of Units. A project may display widely used non-SI units, but tag databases, calculations, interfaces and displays must make units explicit and conversions controlled. A number without a unit is not a process measurement. A unit without the pressure reference, flow basis or level datum can still be ambiguous.
| Measurement job | Required definition | Common hidden ambiguity | Evidence of success |
|---|---|---|---|
| pressure indication | reference type, range, units, location and dynamics | gauge versus absolute; static versus pulsating | compared with appropriate local/reference evidence |
| flow control | mass/volume basis, fluid state, direction, range, update and control objective | actual versus normalized volume; bidirectional sign | controller response and independent process balance |
| flow totalization | rate basis, time base, low-flow handling, validity and reset/retention policy | integrating stale or bad flow; unit mismatch | total reconciles over a defined interval |
| continuous level | datum, innage/ullage, interface, range and vessel conditions | distance is mistaken for level; density/vapor ignored | verified at multiple stable levels |
| level-derived volume | valid geometry/strapping revision and interpolation method | applying a linear percent to nonlinear vessel volume | known fill/withdrawal or approved reference comparison |
| point alarm/trip | actuation point, reset, test method and independence | software threshold treated as independent switch | proof test under the approved alarm/safety plan |
Define required performance from the process decision
Accuracy is not one universal catalog number. The usable measurement result is influenced by the sensing element, reference conditions, installation, transmitter configuration, analog or digital interface, input module, scaling, environment, dynamics, calibration and process model. Define permitted error or uncertainty across the operating range and conditions, response time, repeatability, hysteresis, resolution, drift, diagnostic coverage, availability and proof/test interval needed by the decision.
Avoid selecting a 0.1% transmitter without defining what the percentage is of, under which reference conditions, and how the rest of the measurement chain contributes. Also avoid excessive precision that the process cannot support. A high-resolution PLC value does not recover information lost through a poorly ranged transmitter, unstable process connection or invalid physical model.
Understand the complete measurement chain
Carry value, quality, unit and age together
The process value is only one part of the data contract. Quality states whether the producing device/channel considers the value valid and whether it is limited, substituted, fixed or otherwise abnormal. Unit identifies the physical meaning. Age or timestamp shows whether the value is current enough for its consumer. Range and status information explain conditions such as underrange, overrange, sensor fault, maintenance required or configuration change where supported.
The FieldComm Group's HART-IP technical description describes process-variable status containing measurement quality and limit condition. Its HART version comparison explains device-variable status and configuration-change information for relevant revisions. Exact device, host and gateway support still matters; a 4–20 mA primary value does not automatically deliver every digital diagnostic to the PLC.
| Chain boundary | Design record | Runtime evidence | Failure category |
|---|---|---|---|
| process | measurand, state, fluid/material and operating envelope | independent observation/reference and time | process not as assumed |
| primary element/sensor | principle, wetted exposure, range and influence quantities | local physical condition and sensor diagnostics | fouling, blockage, coating, echo or damage |
| installation | location, orientation, taps, piping, grounding, nozzle and environment | inspection and mode-correlated behavior | installation creates bias/noise/delay |
| transmitter | exact device/revision, LRV/URV, units, damping, output and status | local reading, configuration checksum/change and diagnostics | range/unit/zero/configuration error |
| field signal/network | loop, pulse or digital mapping and power/reference | measured current/pulse/link/status under approved procedure | power, wiring, noise, lost packets or stale gateway data |
| PLC input | module/channel/range/filter/update and raw/status representation | raw data, channel quality and module diagnostics | wrong range, channel or mapping |
| conversion/validation | formula, units, limits, quality/age policy and ownership | intermediate values and reason codes | double scale, wrong unit, stale/fixed accepted |
| consumer | HMI, alarm, control, totalizer, historian and safety boundary | displayed value, command and independent result | correct value used incorrectly |
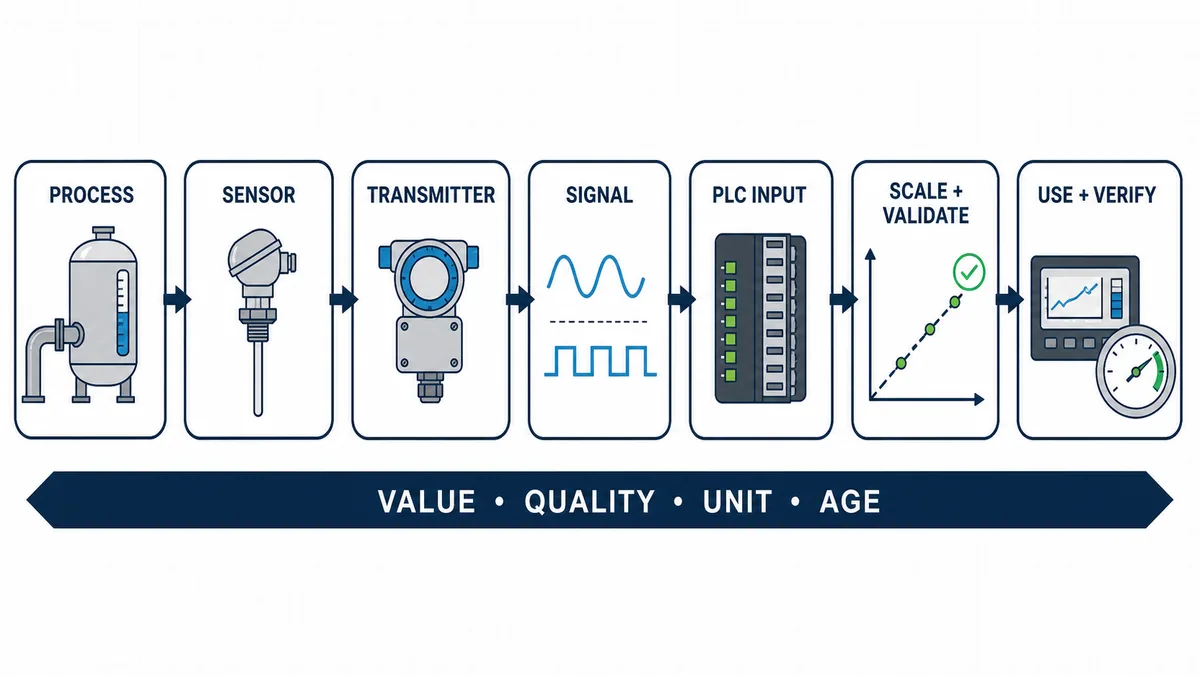
Select pressure measurement correctly
Choose gauge, absolute or differential reference
Gauge pressure is referenced to ambient atmospheric pressure at the instrument's reference. Absolute pressure is referenced to vacuum. Differential pressure is the difference between two pressure connections. The numerical values are not interchangeable: atmospheric change affects a gauge/absolute comparison, and a DP transmitter responds to both high- and low-side conditions.
Choose the reference from the process question. Pump discharge pressure may be gauge; vacuum process performance may need absolute; filter condition may use differential pressure; closed-vessel hydrostatic level may use differential pressure to compensate vapor-space pressure. Record the reference in the tag, units/data model and display. Writing bar or psi without gauge, absolute or the two DP points invites a silent engineering error.
Specify range, overload, media and dynamics separately
Normal range, calibrated span, permissible overrange, proof pressure and burst pressure are different concepts defined by the exact device. Verify vacuum exposure, static pressure on a DP transmitter, line pressure, surge/pulsation, pressure cycling, temperature, wetted materials, seals/fill fluids, process connection, hazardous area and cleaning conditions. A narrow calibrated span can improve signal use but may not tolerate the process upset or provide the required uncertainty under turndown.
Installation can dominate performance. Impulse lines can plug, leak, trap gas or liquid, freeze, heat/cool, create unequal head or respond slowly. Remote seals add fill-system behavior and temperature effects. A transmitter mounted above or below the process datum can require a controlled zero adjustment or calculation. Do not “zero out” a real process or installation head without recording the physical model.
| Pressure selection item | Questions | Frequent error |
|---|---|---|
| reference | gauge, absolute or differential between which points? | displaying bar with no reference |
| operating envelope | normal, startup, vacuum, surge, blocked and cleaning states? | span selected from normal state only |
| static/overload | line/static, overrange, proof and burst constraints? | treating proof pressure as usable range |
| process interface | media compatibility, plugging, corrosion, solids, sanitary need and temperature? | compatible sensor with incompatible seal/fitting |
| dynamics | pulsation, response time, damping and control bandwidth? | damping hides a real transient or no damping creates chatter |
| installation head | elevation, impulse/seal fill, gas/liquid legs and ambient gradients? | unexplained zero offset corrected in the PLC |
Select flow measurement from the fluid and measurement basis
Define mass, actual volume, normalized volume or velocity
Volumetric flow depends on the actual fluid state and pipe volume. Mass flow represents mass per time. Gas “standard” or “normal” volume depends on explicitly stated reference pressure, temperature and compressibility conventions. A PLC must not relabel actual volumetric flow as standardized volume or mass without the necessary measurements and approved calculation.
Decide whether the instrument or PLC/flow computer owns pressure/temperature/density compensation, square-root extraction, low-flow cutoff and totalization. Perform each transformation in one controlled location and record its inputs, units and conditions. Duplicate compensation can create plausible but wrong results that are hard to diagnose.
Match the technology to process and installation constraints
A magnetic flowmeter generally requires a conductive fluid, a full measuring tube, compatible wetted materials/liner and correct grounding/bonding under its manual. Emerson's official Rosemount magnetic flowmeter reference manual explicitly includes process-fluid conductivity, full-pipe, entrained gas and grounding/cabling checks for that product. Those exact thresholds and rules are not universal across all meters.
Coriolis instruments can measure mass flow and often density/temperature-related variables, but tube geometry, pressure drop, two-phase flow, vibration, material compatibility, size and cost matter. Vortex instruments depend on suitable fluid/flow regime and installation. Ultrasonic meters depend on acoustic path, fluid and installation; clamp-on systems add pipe-property and coupling variables. Turbine/paddle and positive-displacement meters have moving-part, viscosity, wear and pulse considerations. Differential-pressure primary elements trade familiar standardized models against pressure loss, square-root behavior, impulse-system maintenance and installation conditions.
ISO 5167-1:2022 defines general principles for specified differential-pressure devices in full circular conduits under its stated conditions, including single-phase, subsonic and non-pulsating scope boundaries. Do not cite it as approval for every DP meter or disturbed/multiphase/pulsating application. Use the relevant part, installed geometry and uncertainty method.
| Flow technology | Measures/derives | Strong fit when | Critical checks |
|---|---|---|---|
| magnetic | volumetric flow from conductive-fluid velocity | conductive liquids/slurries with full pipe and compatible liner/electrodes | conductivity, full pipe, gas, grounding, profile and material compatibility |
| Coriolis | mass flow; often density and temperature variables | direct mass basis and suitable size/process conditions | pressure loss, two-phase behavior, vibration, zero stability and materials |
| differential pressure | flow inferred from pressure drop and primary-element model | applicable standardized/engineered primary element and maintainable impulse system | fluid/model scope, density, installation, square root, taps and pressure loss |
| vortex | volumetric/mass-derived flow from shedding frequency | suitable clean fluid and Reynolds/process conditions | vibration, low flow, pipe profile, density/compensation and installation |
| ultrasonic | transit-time or Doppler-related flow | compatible acoustic path and installation access | pipe/fluid properties, bubbles/solids regime, profile, coupling and path |
| turbine/pulse | velocity/volume represented by rotor pulses | clean compatible fluid and maintained moving element | viscosity, wear, pulse frequency, K-factor, direction and totalization |
| positive displacement | discrete displaced volume cycles | viscous or low-flow service within device limits | pressure drop, wear, pulsation, entrained material and mechanical protection |
Select continuous and point level measurement separately
Define level, distance, interface, volume or mass
A top-mounted radar or ultrasonic instrument often measures distance to a surface. The transmitter converts that distance to level using an empty-distance/datum configuration. Hydrostatic or DP instruments infer level from pressure and density. Capacitance responds to electrical properties and geometry. Float, displacer, magnetostrictive and guided-wave technologies interact differently with the product and interface. A point switch answers whether material has reached a defined location; it is not a continuous transmitter with fewer bits.
State whether the application needs liquid surface, solid bulk level, interface between products, ullage, volume, mass, point high/low detection or independent overfill protection. Record vessel geometry, nozzles/internals, agitators, fill streams, foam, dust, vapor, dielectric constant, density and its variation, temperature, pressure, condensation, coating, turbulence and empty/full dead zones.
Match non-contact and contact technologies to the vessel
Radar can be robust across many conditions, but antenna/nozzle geometry, false echoes, dielectric response, buildup and device-specific blocking distance still matter. Siemens' official SITRANS LR100 operating instructions describes product-specific mounting and false-echo procedures. Those settings are commissioning evidence, not permission to ignore a poor installation.
Ultrasonic measurement depends on acoustic propagation and can be affected by vapor, temperature gradients, foam, dust, turbulence and obstructions. Guided-wave radar interacts with a probe and can suit interfaces or constrained geometry under exact product conditions. Hydrostatic measurement is simple in appropriate liquids but depends on density and reference pressure. Capacitance and admittance methods depend on material electrical properties and buildup. Float or displacer mechanisms introduce mechanical, density and maintenance considerations.
Endress+Hauser's official pressure-based level overview explains continuous level and related volume/mass use through pressure or differential pressure in the applicable liquid context. The process model and exact device manual remain decisive.
| Level question | Selection consequence | Failure if ignored |
|---|---|---|
| continuous or point? | transmitter versus switch architecture and test | one software threshold mistaken for independent protection |
| surface or interface? | sensing principle and configuration | instrument tracks the wrong reflection/interface |
| open or closed vessel? | gauge/hydrostatic versus vapor-compensated DP/reference | vapor pressure appears as level change |
| density stable? | hydrostatic/DP accuracy and compensation | same pressure maps to different level |
| foam, vapor, dust or agitation? | radar/ultrasonic/probe selection and signal processing | lost/false echo or unstable reading |
| nozzles and internals? | beam/probe placement and false-echo map | ladder/agitator/fill stream becomes target |
| level or volume? | geometry formula/strapping table and revision | linear percent gives wrong inventory |
| overfill consequence? | independent protection and proof-test architecture | control measurement becomes single point of failure |
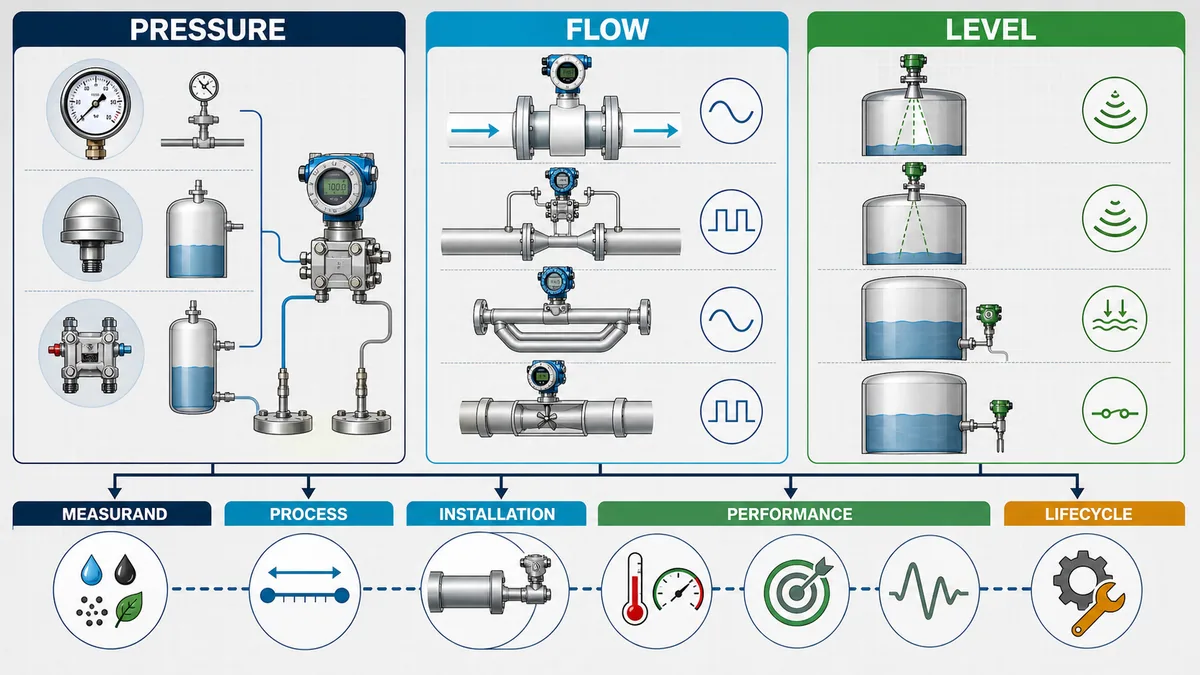
Live mini-lab
Try it: press START, then STOP
A stop-dominant seal-in rung: START latches the motor output through its own contact, and STOP breaks the circuit.
Watch the output lamp: it stays on after START until you press STOP.
Free · no signup to try · runs in your browserOpens plcsimulationsoftware.com — same team
Integrate the instrument with PLC I/O and data
Choose the signal from required information and lifecycle
Common interfaces include 4–20 mA, voltage, pulse/frequency, contact/solid-state point outputs, HART over current loop, IO-Link, fieldbus and industrial Ethernet. Choose from required process data, diagnostics, update/determinism, distance/environment, power architecture, hazardous-area barriers, configuration/asset-management needs and installed platform support.
An analog current loop can be robust and easy to measure, but it carries a limited primary value and diagnostic convention unless hybrid/digital information is integrated. A pulse can totalize precisely only if the input frequency, electrical interface, counter behavior and K-factor are correct. A digital device can expose multiple variables and status, but mapping, profile, byte order, units, identity, update, failover and configuration ownership must be engineered.
The PLC analog I/O signals guide owns detailed active/passive loop topology, module configuration, raw/status behavior and analog fault diagnosis. The PLC inputs and outputs guide owns the wider point lifecycle. Here the essential rule is to keep transmitter configuration, signal behavior, channel range and engineering conversion aligned.
Define one source of scaling truth
Record transmitter lower/upper range values, output mapping, units, transfer function, damping, failure behavior and digital variables. Record PLC module range, raw representation, status/quality, filter/update and tag mapping. Decide whether scaling occurs in the transmitter, I/O module, PLC library, gateway or HMI. Avoid two hidden scaling layers and never use the HMI as the only authoritative process conversion for control.
| Interface | PLC evidence | Main design risk |
|---|---|---|
| 4–20 mA | measured current where authorized, raw counts/value, channel status, configured range | active/passive mismatch, range mismatch, power/reference loss, hidden fail-current handling |
| voltage | source/load compatibility, common-mode/reference and raw/status | drop/noise/reference and input-impedance effects |
| pulse/frequency | electrical state, counter diagnostics, frequency and time base | missed pulses, overflow, wrong K-factor or direction |
| HART hybrid | analog PV plus device identity/variables/status/config-change support | assuming digital status reaches a host that does not map it |
| IO-Link | master port mode, process-data layout, value status, device identity and events | wrong IODD/profile, byte layout or replacement policy |
| fieldbus/Ethernet | device/profile, mapped values/units/status, update and connection diagnostics | stale valid-looking data, gateway remap or version mismatch |
Scale and validate a 4–20 mA value
Work a linear pressure example with units
Assume the controlled transmitter configuration maps 4 mA to lower range value 0 kPa and 20 mA to upper range value 1000 kPa. Its span is 1000 kPa. For measured loop current I, the linear conversion is:
PV = LRV + ((I − 4 mA) / 16 mA) × (URV − LRV)
At 12 mA, the normalized fraction is (12 − 4) / 16 = 0.5, so PV = 0 kPa + 0.5 × 1000 kPa = 500 kPa.
| Current checkpoint | Normalized fraction | Pressure result | What the checkpoint can reveal |
|---|---|---|---|
| 4 mA | 0.00 | 0 kPa | LRV, offset and zero-direction agreement |
| 8 mA | 0.25 | 250 kPa | quarter-span slope and range direction |
| 12 mA | 0.50 | 500 kPa | midpoint scaling and double/partial scaling errors |
| 16 mA | 0.75 | 750 kPa | upper-span slope and clamping |
| 20 mA | 1.00 | 1000 kPa | URV/span agreement |
These current values test a configured signal conversion; they do not calibrate the pressure sensor or prove actual process pressure. The current source, meter or calibrator must be appropriate to the procedure, and the PLC must expose raw value and channel status. Confirm all expected points and relevant diagnostic states.
Keep diagnostic state separate from engineering value
Some transmitters can drive current outside the normal measurement band for fault indication; exact values, direction, saturation and standards/profile settings are device- and configuration-specific. Analog modules also differ in how they represent underrange, overrange, open circuit and invalid status. Do not treat every current below 4 mA or above 20 mA as the same fault, and do not clamp it silently into 0–1000 kPa before quality evaluation.
Represent at least value, quality/reason and timestamp/age. Decide how each consumer responds. An HMI may show last value with a stale badge; a totalizer may pause and alarm; a controller may hold, track or transfer according to the approved strategy; a safety function follows its validated architecture rather than generic PLC behavior.
Calculate hydrostatic level with density and reference pressure
Use the pressure-head model only within its assumptions
For a static open liquid column with the transmitter measuring gauge pressure relative to the same atmosphere at the surface, an idealized level estimate is:
h = Δp / (ρg)
where h is vertical liquid height in metres, Δp is hydrostatic pressure in pascals at the measurement datum, ρ is liquid density in kilograms per cubic metre under the process conditions and g is local gravitational acceleration in metres per second squared. The actual installation may require elevation, tap, diaphragm/seal, capillary, wet/dry leg, interface or geometry corrections.
Assume Δp = 19.58 kPa = 19,580 Pa, ρ = 998 kg/m³ and g = 9.80665 m/s². Then:
h = 19,580 / (998 × 9.80665) ≈ 2.00 m
If the same pressure is produced by a lighter liquid with ρ = 900 kg/m³, then:
h = 19,580 / (900 × 9.80665) ≈ 2.22 m
The PLC cannot infer both level and unknown density from one pressure value without additional information. Temperature/composition can change density; stratification or interface behavior can break a single-density assumption. State the source and validity of density and propagate the resulting uncertainty.
Compensate closed-vessel vapor pressure correctly
In a closed pressurized vessel, bottom gauge pressure includes vapor-space pressure plus hydrostatic head. A suitable differential measurement can subtract the vapor-space pressure, but impulse legs, wet legs, remote seals, fill-fluid density, elevation and temperature add their own head and dynamics. Use the exact transmitter/seal calculation and commissioning procedure. Do not vent a process connection or manipulate a pressurized impulse system from a generic article.
| Hydrostatic input | Required evidence | Wrong assumption symptom |
|---|---|---|
| bottom/high-side datum | tap/diaphragm elevation and vessel datum | constant zero offset or incorrect empty reading |
| surface/low-side reference | atmosphere, vapor space, wet/dry leg or remote seal | level follows vessel pressure |
| density | value versus temperature/composition and interface | span changes by batch or season |
| gravity/unit conversion | project convention and consistent units | small systematic bias or gross unit error |
| transmitter range | LRV/URV including elevation/seal heads | clipped or reversed output |
| process state | static/dynamic, agitation, gas entrainment and line condition | noisy/delayed value not caused by PLC |
Handle differential-pressure flow square root exactly once
Understand the normalized relation
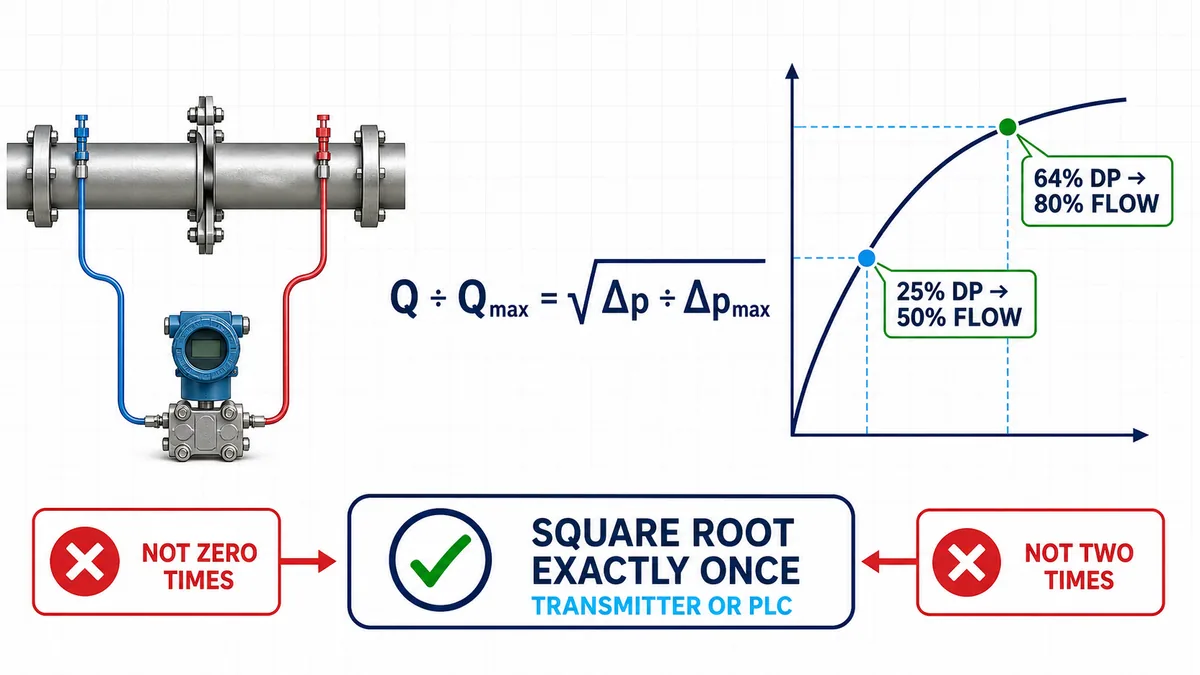
For an applicable differential-pressure primary-element model under stable defined conditions, differential pressure varies approximately with flow squared. A normalized teaching relation is:
Q / Qmax = √(Δp / Δpmax)
At 25% of calibrated maximum DP, normalized flow is √0.25 = 0.50, or 50% flow. At 64% DP, normalized flow is √0.64 = 0.80, or 80% flow. This simple relation illustrates square-root behavior; an actual calculation can require discharge coefficient, geometry, density, expansibility and other terms under the governing method.
Put extraction and compensation in one controlled owner
A DP transmitter can output a linear DP signal or a square-rooted flow-related signal. A PLC or flow computer can also perform extraction. Record which layer owns it. If no layer performs the required square root, the displayed flow is too low across much of the range relative to the intended model. If the transmitter and PLC both square-root, the result is also wrong but can remain smooth and plausible.
Check density basis and compensation. Gas and steam flow often require pressure/temperature and fluid-property treatment beyond a fixed-density square-root block. Low-flow cutoff can intentionally force a range of values to zero; its ownership and setting affect control and totalization. Pulsation, multiphase flow, plugged/wet impulse lines and primary-element damage cannot be repaired in software by changing the exponent.
Convert level to volume and totalize flow safely
Use vessel geometry or a revision-controlled strapping table
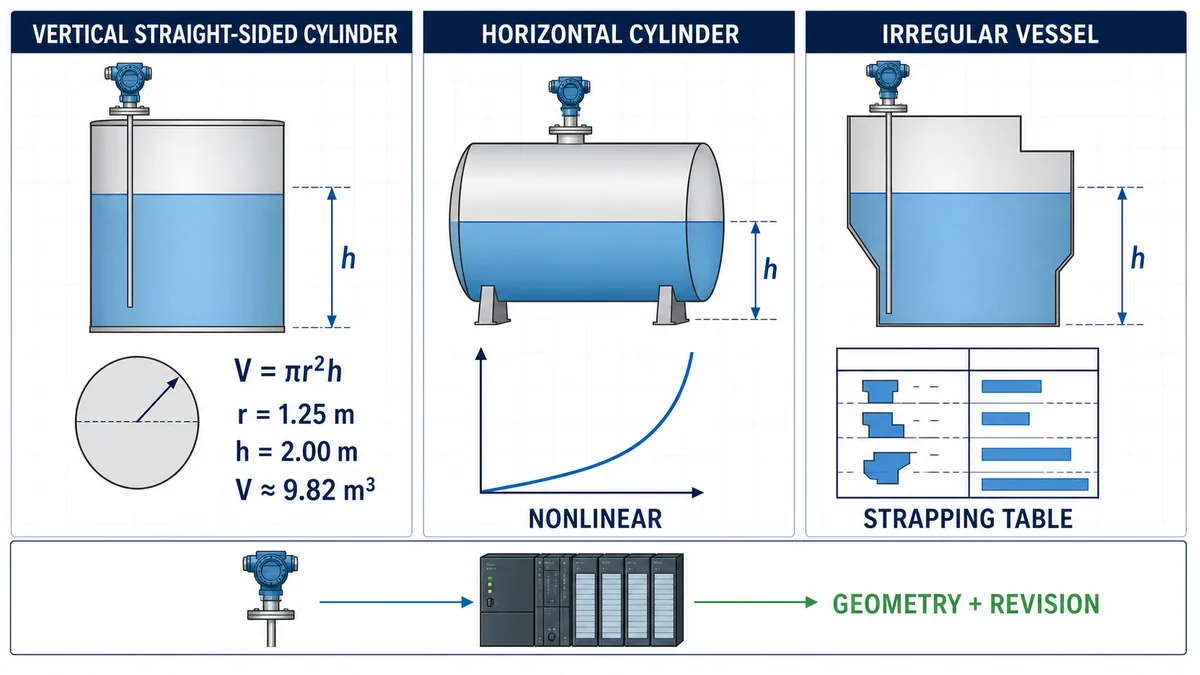
For a vertical, straight-sided right circular cylinder with flat bottom and level entirely within the constant-area section, liquid volume is V = πr²h. With r = 1.25 m and h = 2.00 m:
V = π × (1.25 m)² × 2.00 m ≈ 9.82 m³
This formula does not include dished heads, cone bottoms, internal displacement or irregular cross-sections. A horizontal cylinder has a nonlinear area-versus-height relation. A real tank may use a calibrated strapping table indexed by level, sometimes with temperature or other corrections. Store table identity, units, interpolation/extrapolation policy and revision. Alarm if the input is outside the valid table domain rather than silently extending the last segment.
| Vessel/quantity | Conversion | Required control |
|---|---|---|
| vertical constant-area cylinder | V = πr²h within valid straight section |
exact radius/datum and head/internal-volume exclusions |
| rectangular constant-area vessel | plan area × valid height | internal structures, dead volume and datum |
| horizontal cylinder | circular-segment relation plus length | orientation, end geometry, units and numerical boundary handling |
| irregular/formed vessel | approved strapping/calibration table | revision, interpolation, valid range and temperature basis |
| mass from volume | volume × density | density source, conditions, stratification and uncertainty |
| percent display | normalized valid level/volume range | do not confuse level percent with volume percent |
Integrate flow using actual elapsed time and quality
For flow Q in cubic metres per hour over elapsed time Δt in seconds, an interval volume contribution is ΔV = Q × Δt / 3600. If valid flow is constant at 18 m³/h for 5 min = 300 s, then ΔV = 18 × 300 / 3600 = 1.5 m³.
In a PLC, use actual or controlled elapsed time appropriate to the task rather than assuming every scan is identical. Define what happens during bad/stale quality, restart, time change, communication loss, reverse flow, low-flow cutoff and totalizer rollover. Retentive totals need controlled initialization, reset authority and audit. For fiscal/custody or regulated totals, use the required certified architecture and standards rather than a generic PLC accumulation rung.
Design quality, validation and control behavior
Validate plausibility without pretending it proves correctness
Range, rate-of-change, stuck-value, cross-sensor and process-balance checks can detect failures, but each has false-positive and common-cause limits. A level can legitimately remain constant. Flow can change rapidly during a valve sequence. Pressure and flow can both look plausible while the process line is blocked at a different location. Validation should add a reason code and preserve the original measurement/status for diagnosis.
Use multiple states: good; uncertain/suspect; bad; stale; simulated/forced; maintenance; substituted; and limited high/low where the platform supports them. Consumers should not collapse all invalidity to zero. Alarm philosophy defines annunciation and operator guidance. Control strategy defines hold, track, transfer, shutdown or fallback. Historian records should preserve status and configuration context.
Keep control, alarm and safety independence explicit
A continuous level transmitter can drive normal control and a high alarm, but that does not automatically make the alarm independent. An independent overfill or protective function may require separate sensing, logic, final action, power and proof testing determined by the risk assessment and applicable standards. Similarly, a PLC pressure alarm does not become a certified pressure safety function because its threshold is conservative.
Document shared dependencies: process connection, impulse line, power supply, I/O, network, controller, software, final element and human response. Functional safety and overfill protection require their own engineering/validation. This guide does not assign a SIL, performance level or proof-test interval.
Commission each measurement end to end
Freeze identity, configuration and acceptance criteria
Before the loop test, approve the instrument index/I/O list, P&ID or process schematic, data sheet, range/unit/datum, exact device/revision, installation drawing, wiring/network record, channel configuration, scaling/quality behavior, alarms/interlocks, calibration requirements, reference equipment and acceptance tolerances. Record who may simulate, adjust, bypass, force or return the loop to service.
IEC 62828-1:2026 establishes current general procedures for assessing industrial/process measurement transmitters, with pressure, temperature, level and flow specifics in other series parts. It distinguishes reference conditions and performance evaluation from a casual field check. Use the applicable product/industry procedure and acceptance contract.
Test each boundary and state what the test proves
An end-to-end commissioning sequence may include document and installation inspection; device identity/configuration capture; local zero/range or manufacturer-prescribed checks; safe signal simulation at defined points; PLC raw/status and engineering-value verification; HMI/alarm/control mapping; process comparison at stable points; abnormal status and communication-loss behavior; trend/dynamics review; restoration and as-left evidence. Sequence and isolation must follow the approved procedure.
A current injection at the PLC input proves the input/scaling/consumer path from that injection point. It does not prove transmitter sensing, impulse lines, process connection or real process accuracy. A transmitter output simulation includes more of the loop but still does not prove the sensing element. A process reference comparison exercises more of the chain but must have suitable uncertainty and process stability.
NIST's metrological traceability FAQ and policy explains traceability as a property of a measurement result through a documented unbroken calibration chain, with each link contributing uncertainty. It also warns that traceability alone does not make a result fit for purpose. Record the result, reference, uncertainty and conditions—not only a calibration sticker.
| Test point | Proves | Does not prove |
|---|---|---|
| PLC software simulation | consumer logic, display and alarm path for simulated tag | I/O, signal, transmitter, installation or process |
| current/pulse injection at input | channel, raw representation, scaling and downstream use | field wiring and transmitter sensing |
| field-loop simulation | field cable, barriers/isolators, channel and downstream use from test point | process connection and primary sensing accuracy |
| transmitter internal simulation | configured output/mapping and downstream path | sensing element and process installation |
| applied pressure/level/flow reference | more complete installed measurement response within test method | every operating condition, dynamic or long-term drift |
| process material balance/reference | system performance under observed state | fault isolation without adequate reference uncertainty |
Troubleshoot by symptom and evidence boundary
Start with the exact symptom, mode and last change
Record whether the value is wrong but plausible, zero, at/near full scale, noisy, frozen, delayed, drifting or incorrect only during a pump, valve, agitator, cleaning, pressure or product transition. Capture local transmitter value/status, PLC raw value/quality, scaled tag, HMI value, process reference and timestamps together. Ask what changed: transmitter range, firmware/configuration, impulse line, pipe/vessel, product density, module/channel, program, gateway, HMI or maintenance work.
Do not replace the transmitter first because the HMI number is wrong. A good local value and wrong PLC raw value point downstream. A wrong local value and correct applied reference can point to configuration or sensing/installation. A correct raw value and wrong engineering tag point to mapping/scaling. A correct tag and wrong HMI points to consumer mapping or units. Correlation narrows the boundary; it does not prove cause without the relevant evidence.
| Symptom | Process/instrument causes | Signal/PLC causes | Discriminating evidence |
|---|---|---|---|
| wrong but plausible | wrong range/unit/reference, density/geometry, zero head, coating/echo, disturbed flow | wrong scale, unit conversion, square root twice/never, wrong tag | compare local PV, raw/status, configuration and reference |
| zero/low | real empty/no flow, blocked low reading, lost echo, low-flow cutoff, line/tap issue | open/power/reference loss, underrange clamped, wrong channel | raw current/status plus device and process evidence |
| full scale/high | real upset, plugged low side, false echo, range too small | overrange clamped, short/reference issue, signed/datatype error | local status, applied stimulus and raw boundaries |
| noisy | turbulence/pulsation, entrained gas, cavitation, vibration, echo/foam, impulse resonance | grounding/shielding/power noise, filter/update or network variation | synchronized trend with machine/process state and raw/local values |
| frozen | blocked/frozen line, lost echo with hold, device fault or maintenance mode | stale gateway, retained/substituted value, task/mapping stopped | age/timestamp, device update and changing stimulus |
| delayed | impulse/capillary/thermal response, damping, low process dynamics | input filter, network update, task scan or historian/HMI delay | time-align stimulus, local PV, raw and consumer timestamps |
| mode-specific | density/temperature, pipe not full, vapor/foam, valve/pump state | shared power, EMC, compensation state or sequence logic | compare identical signal chain across operating modes |
Use a safe, ordered isolation workflow
- Confirm the tag, units, pressure/flow/level basis, operating mode and consequence of intervention.
- Review alarms, status, timestamp/age, recent changes and approved drawings/configuration.
- Compare independent process evidence with local device PV and diagnostics.
- Inspect the installation condition appropriate to the device: taps/lines, full pipe, grounding, nozzle/echo, coating, vessel/pipe state or mechanical element.
- Compare field signal or digital mapped value with PLC raw/status data using the approved test method.
- Trace range, unit, square-root, density, geometry, compensation, filtering and quality ownership through the PLC.
- Compare the validated tag with HMI, alarm, control, totalizer and independent process response.
- Change one justified variable, predict the result, capture evidence, restore controls and update the as-built/configuration record.
Pressure systems and pressurized impulse lines can release hazardous energy or process material. Electrical loops can cross hazardous-area and intrinsic-safety boundaries. Follow site lockout, isolation, depressurization, permit and qualified-work requirements. OSHA 1910.147 provides the US hazardous-energy baseline in its scope; local process-safety procedures and other regulations may be stricter.
Diagnose performance, calibration and uncertainty
Separate resolution, repeatability, error and uncertainty
Resolution describes represented increments, not truth. Repeatability describes closeness under repeated specified conditions. Hysteresis, nonlinearity, zero/span error, drift, temperature influence and dynamic response contribute differently. Measurement uncertainty describes quantified doubt associated with the result under the model and conditions. Do not add every percentage blindly; define whether each term is of reading, span or URL and whether it is independent, correlated or already included.
A PLC may display 500.000 kPa while the combined system supports far less precision. Round display and historian values to useful resolution while retaining sufficient internal precision for calculations. Preserve the device's status and configuration. Use uncertainty/acceptance guard bands where decisions approach critical limits, under the responsible metrology and engineering procedure.
Distinguish calibration, adjustment and verification
Calibration establishes a relationship between indications and reference values under stated conditions; adjustment changes the instrument; verification checks specified requirements. A technician may compare and find an error without adjusting. After adjustment, repeat required as-left points and record both as-found and as-left condition. A zero trim, sensor trim and output trim affect different parts of a smart transmitter; use the exact manufacturer procedure.
| Record | Why it matters |
|---|---|
| measurand, range, units and reference conditions | defines what the result means |
| exact device/configuration and installation | makes influence factors and reproduction traceable |
| reference identity, calibration status and uncertainty | supports the traceability chain and fitness review |
| as-found results | reveals drift, damage and prior process exposure |
| adjustment performed | explains configuration change and avoids hidden bias removal |
| as-left results and uncertainty/tolerance decision | proves the accepted state under the procedure |
| date, environment, technician/procedure and next trigger | controls lifecycle and refresh conditions |
Diagnostic answer map for pressure, flow and level questions
If someone asks which pressure transmitter to use with a PLC
Answer with the reference and process envelope first: gauge, absolute or differential; normal/upset/vacuum/static pressure; span/turndown; media and wetted materials; temperature; dynamics; connection/impulse or seal system; hazardous/environmental approvals; required uncertainty; output/protocol; diagnostics and maintenance. Then match the exact transmitter and PLC channel. A nominal pressure range alone is not a selection.
If someone asks which flow meter is best
Ask whether the required result is mass, actual volume, normalized volume, velocity or total; fluid phase, composition, conductivity, viscosity, density and temperature/pressure variation; pipe size/material/fullness and profile; range/turndown/direction; allowable pressure loss; solids/bubbles; cleaning; uncertainty; and lifecycle. Compare suitable technology families against those constraints. There is no universal best flow meter.
If someone asks how to measure tank level with a PLC
Define continuous level versus point detection, surface/interface, open/closed vessel, geometry and datum, product density/dielectric behavior, vapor/foam/dust/agitation, nozzles/internals, pressure/temperature, coating and overfill consequence. Select and commission the exact instrument, map value plus quality/age, then convert to volume only with valid geometry or strapping data.
If someone asks why PLC pressure differs from the transmitter display
Compare units and range at the transmitter; local PV/status; measured output where authorized; PLC input configuration and raw/status; scaling and unit conversion; tag mapping; HMI conversion and data age. A local display can show the primary variable while the analog output or PLC maps a different range or variable. Prove the first boundary where values diverge.
If someone asks why DP flow is wrong at low flow
Check whether square-root extraction occurs exactly once, the DP transmitter range, low-flow cutoff, primary-element/tap/impulse condition, density/compensation, process flow regime and installed geometry. Because DP falls with flow squared, low-flow DP becomes small and installation/zero uncertainty can dominate. Do not fix it by arbitrary scaling without the physical evidence.
If someone asks where to practise process scaling
Use a controlled simulator to practise the linear current-to-engineering-unit calculation, midpoint/endpoints, permissive behavior and graded checks. Then transfer the method to the exact transmitter, module, diagnostics and approved field procedure. Simulation builds reasoning; it does not certify a real instrument or replace process isolation.
Frequently asked questions
What is the difference between pressure, flow and level measurement in a PLC?
Pressure is force per area relative to a defined reference, flow is quantity passing a boundary per time, and level is a position or amount-related measurement within a vessel. They can be physically related—pressure can infer level or flow—but the model, process properties and installation must be valid. The PLC receives a signal/data representation, not the physical quantity directly.
How do I scale a 4–20 mA pressure transmitter in a PLC?
Confirm the transmitter LRV, URV, units and output mapping plus the input module's configured range/raw representation. For a linear mapping, use PV = LRV + ((I − 4 mA) / 16 mA) × span, then validate low, midpoint and high points and handle channel/device quality before clamping. Exact diagnostic limits are configuration-specific.
Why should the PLC store measurement quality and age?
A value can remain numerically plausible while the device is faulty, the gateway is stale or the channel is limited. Quality explains validity and reason; age shows freshness. Controllers, alarms, totalizers, HMIs and historians need explicit policies for bad, uncertain, stale, simulated or substituted data.
How does differential pressure measure flow?
An engineered primary element creates a pressure difference related to flow under a defined model. In a simplified normalized case, flow fraction is the square root of DP fraction. The actual calculation and uncertainty depend on the primary element, geometry, fluid properties and installation. Square-root extraction must occur exactly once.
How does pressure measure liquid level?
For a suitable static liquid column, hydrostatic head relates to level by h = Δp/(ρg). The pressure reference, density, measurement datum, vessel pressure, taps/impulse lines, seals and temperature must be included. The same measured pressure represents different level when density changes.
Is level percentage the same as tank volume percentage?
Only for a valid constant-area geometry over the range. Horizontal cylinders, cone/dished sections and irregular vessels are nonlinear. Use the correct geometry or revision-controlled strapping table, with explicit units, datum and interpolation policy.
What causes a PLC measurement to freeze at a plausible value?
Possible causes include blocked/frozen impulse paths, lost echoes with hold behavior, device maintenance/substitution, stale gateway data, stopped mapping/task, retained software values or an HMI/historian that stopped updating. Compare timestamps/age, local device change, raw/status and downstream consumers during a changing stimulus.
How do I troubleshoot a noisy flow or level signal?
Correlate local PV, PLC raw value and process state. Check turbulence, pulsation, cavitation, gas/solids, vibration, foam/echo, grounding/shielding, power, installation profile and device/input filtering. Do not add damping until you understand whether the variation is real process behavior or interference.
Does a calibrated transmitter guarantee an accurate PLC value?
No. Calibration evidence applies under stated conditions and uncertainty. Installation, field signal, PLC input, scaling, units, quality handling and process model can still be wrong. Metrological traceability also does not automatically make uncertainty fit for the decision. Verify the complete measurement chain.
Can the normal PLC measurement also be the safety or overfill trip?
Not automatically. The risk assessment and applicable safety/overfill framework determine independence, architecture, diagnostics, proof testing and final action. A normal transmitter and standard PLC threshold can share common failures and must not be described as an independent protective function without validated engineering.
Sources, review scope, and limitations
Primary sources used for this guide
- BIPM SI Brochure, current 9th edition/version: authoritative SI unit and quantity framework.
- NIST metrological traceability FAQ and policy: traceability, calibration-chain, uncertainty and fitness-for-purpose boundaries.
- IEC 62828-1:2026: current general reference conditions and procedures for testing industrial/process measurement transmitters.
- IEC 61298-1:2026: general performance-evaluation considerations for process measurement/control devices outside the updated PMT scope.
- ISO 5167-1:2022 and ISO/TR 9464:2023: official scope and guidance context for specified differential-pressure flow measurement.
- FieldComm Group HART-IP technical description, HART revision comparison and HART specifications page: official process-variable status, device-variable and protocol context.
- Emerson Rosemount 3051S reference manual: product-specific scaled-variable, square-root and DP-level examples.
- Emerson Rosemount 8750W magnetic flowmeter reference manual: product-specific full-pipe, conductivity, entrained-gas, wiring/grounding and troubleshooting conditions.
- Siemens SITRANS LR100 operating instructions: product-specific radar mounting and false-echo context.
- Endress+Hauser pressure-based level measurement: official pressure/DP level application context.
- OSHA 1910.147 and OSHA 1910.333: US hazardous-energy and electrical work-practice boundaries in their scope.
Review and safety limitations
This guide provides a selection, integration, calculation and diagnostic framework. It is not a process hazard analysis, instrument data sheet, pressure-system design, P&ID, impulse-line or wiring drawing, hazardous-area design, calibration procedure, uncertainty budget, custody-transfer calculation, overfill-protection assessment, functional-safety validation or energized/pressurized work instruction. The eight original generated visuals are educational abstractions; their devices, taps, pipe/nozzle positions, arrows, values and green checks do not establish an approved installation or test.
Use exact current device manuals, adopted standards, process and safety specifications, approved drawings, site isolation/depressurization/electrical procedures, suitable reference equipment and qualified instrument/electrical/process authority. Revalidate after changes to product or vessel/pipe, density/composition, pressure/temperature basis, instrument or firmware/configuration, range/units, signal/interface, I/O module, scaling/quality logic, geometry/strapping revision, alarm/control use or safety architecture. Review this article whenever a cited edition or product document changes.
Now run it · free · no signup
Run your first PLC program in your browser
Build one rung, press Run and watch the output change in a free browser lab. Nothing to install and no signup needed to try it.
Ownership disclosure: PLC Programming IO and PLC Simulation Software are operated by the same publisher.
PLC Programming IO Editorial Team
Industrial automation education, references, and software testing
The PLC Programming IO Editorial Team publishes sourced industrial-automation education and documents how material is reviewed, tested, and corrected. A team byline means the publisher is responsible for the page; it does not represent a fictional person or imply an engineering licence.
Coverage:
- • PLC programming concepts and examples
- • Vendor software tutorials and comparisons
- • SCADA, HMI, protocols, and instrumentation
- • Training, careers, and reference material
Review standard:
- • Prefer primary and official sources
- • Record software versions when material
- • Separate tested facts from estimates
- • Publish material corrections
Important scope note
This site provides education, not project-specific engineering approval. Safety, code, and compliance decisions require a qualified person with access to the actual machine and jurisdiction.