Pump PID Flow-Control Example: Model, Code and Tests
Build and test a centrifugal-pump flow loop with explicit 4–20 mA scaling, PI math, fixed execution timing, output limits, anti-windup, manual tracking and fault evidence.
Review status: Vendor-neutral teaching example reviewed against current ISA PID form/unit guidance, IEC 61131-3:2025, Siemens November 2025 PID control documentation, Rockwell PID/PIDE anti-reset-windup and bumpless-transfer documentation, Schneider PID documentation, MathWorks anti-windup references, NIST and OSHA sources; exact pump/system curve, transmitter/VFD, sample interval, algorithm form, gain units, action label, filters, limits, tracking, I/O, interlocks, process protection, machine and safety response require target- and site-specific engineering validation
Direct answer: build the flow loop around measured and applied behavior
A pump PID flow-control loop compares a flow setpoint with a valid measured flow, then adjusts a bounded VFD speed request so the measured flow follows the target. A useful implementation also defines fixed execution timing, engineering-unit scaling, control direction, manual/automatic ownership, applied-output tracking, minimum and maximum operating limits, anti-windup, bumpless transfer, permissives, feedback, fault response and trend evidence. The PID equation alone is not the complete loop.
For the teaching example below, a 4–20 mA transmitter represents 0–500 L/min, the pump VFD accepts a 0–100% reference, and the loop is evaluated every 100 ms in an isolated model. At 12.0 mA, the measured flow is (12−4)/(20−4) × 500 = 250 L/min. A setpoint of 300 L/min therefore creates a positive error of 50 L/min under the convention e = SP − PV; increasing pump speed is expected to increase flow in the defined operating region, so positive correction increases the requested output. Vendor “direct” and “reverse” labels vary—prove the response direction with a controlled output step instead of copying the label.
The production queue assigns pid example 1,200 global / 290 United States monthly searches at saved KD 33 to this existing route. The worked PID calculation guide owns the broad equation/explanation intent; the PID program guide owns reusable loop architecture; the PID tuning guide owns tuning methods; and PID projects owns the wider project portfolio. This page remains the specific pump/VFD flow example.
| Design item | Teaching value | Required real-system evidence |
|---|---|---|
| flow span | 0–500 L/min | transmitter tag, calibrated range, signal type and quality diagnostics |
| input example | 12.0 mA → 250 L/min | exact module raw format, wiring, scaling and calibration evidence |
| setpoint example | 300 L/min | operating envelope, source/limits, rate rules and authorization |
| loop interval | 100 ms | configured task/call interval and measured jitter/overrun |
| output | requested and applied VFD reference, 0–100% | drive reference scale, start/stop ownership, minimum speed and feedback |
| controller | vendor-neutral PI behavior oracle | exact vendor instruction, form, units, action, tracking and anti-windup |
| process model | first-order, 2 s time constant, 5 L/min per output percent | identified pump/system dynamics across approved operating region |
| protection | deliberately outside teaching controller | dry-run, pressure, valve path, motor/VFD and process protection design |
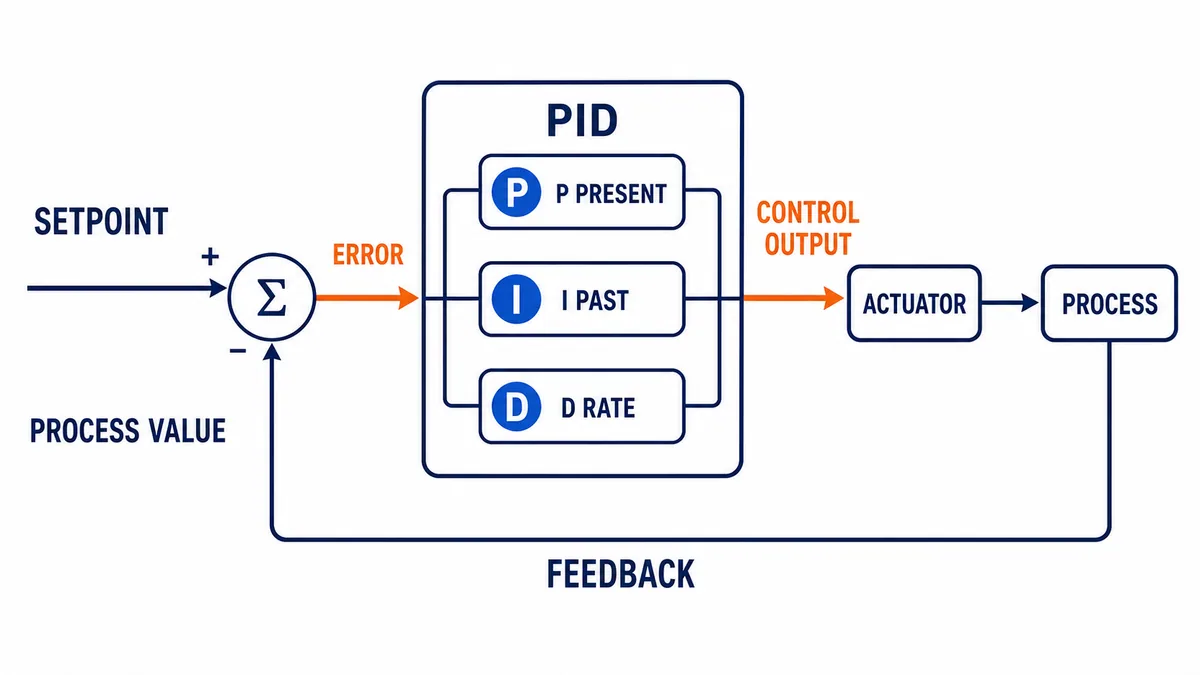
Define the pump, process and control boundary
A VFD does not make every pump operating point acceptable
A centrifugal pump, piping system and control valve—if present—establish an operating point. For geometrically similar operation of the same pump, affinity relationships are commonly summarized as flow proportional to speed, head proportional to speed squared and power proportional to speed cubed. The installed system curve, static head, valve position, fluid properties, cavitation margin, pump efficiency and drive/motor limits determine the actual relationship. Do not use the simple relationships as a guarantee that 60% speed produces exactly 60% design flow.
The control narrative must state who owns pump start/stop, speed reference and unavailable state. A common pattern is:
- the operating sequence establishes a valid flow path and pump availability;
- local logic commands the VFD to run through the approved interface;
- drive-ready/running and process permissives establish whether the loop may control;
- manual mode tracks an authorized bounded output;
- automatic mode uses the PID instruction's documented tracking and anti-windup facilities;
- the applied reference is limited by the approved operating envelope;
- dry-run, pressure, valve, motor, drive and independent protective functions act outside the tuning equation;
- loss/fault behavior is explicit and tested.
This example cannot select minimum speed, bypass/recycle requirements, shutoff limits, maximum flow, ramp time or restart policy. Those are pump/system, process and risk decisions.
Build the signal and mode contract
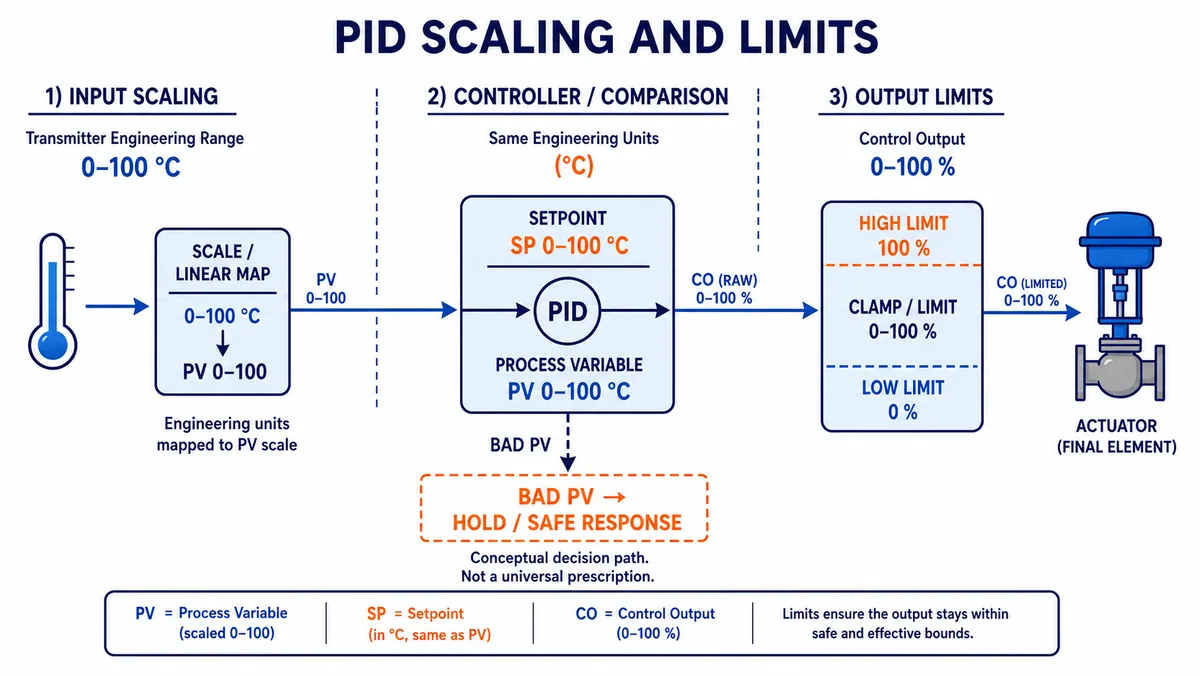
Scale the input once and preserve its quality
If the engineering layer receives current in milliamps, linear scaling is:
Flow = (Current_mA − 4 mA) / (20 mA − 4 mA) × (500 − 0) L/min
At 4, 8, 12, 16 and 20 mA, the ideal values are 0, 125, 250, 375 and 500 L/min. A real PLC analog module usually provides raw counts and diagnostic/status data rather than a floating-point mA value. Use the exact module manual to convert its documented raw format; do not paste a universal count such as 27,648 into every platform. Define underrange, overrange, wire-break and bad-quality policy. Bad flow data should not silently become 0 L/min and drive the controller to maximum.
| Signal | Type/unit | Valid and abnormal rule | Owner and use |
|---|---|---|---|
FlowRaw |
exact module type/count | documented module range plus status | I/O layer only |
FlowPV |
REAL, L/min | 0–500 for this example; separate quality Boolean/enum | validated measurement to PID/trend |
FlowSP |
REAL, L/min | bounded and optionally rate-limited by operating requirement | authorized supervisory/local source |
FlowQualityGood |
BOOL or quality enum | false on module/channel/stale/config fault | blocks automatic calculation and alarms separately |
AutoRequest |
BOOL | request, not proof of active mode | operator/sequence request |
AutoActive |
BOOL | true only when all mode-transfer conditions complete | loop mode evidence |
ManualMV |
REAL, % | bounded; authorization and ramp rules defined | manual operator/commissioning request |
RequestedMV |
REAL, % | raw controller/manual request before final arbitration | diagnosis and tracking |
AppliedMV |
REAL, % | actual value sent after limits/interlocks/ramp | final controller feedback/trend |
DriveRunning |
BOOL | independent drive status, not command echo | equipment feedback |
LoopStatus |
enum/bitset | disabled, manual, auto, tracking, saturated, bad PV, unavailable | operator and fault evidence |
Download the pump PID signal and mode contract.
Fix the loop timing before choosing gains
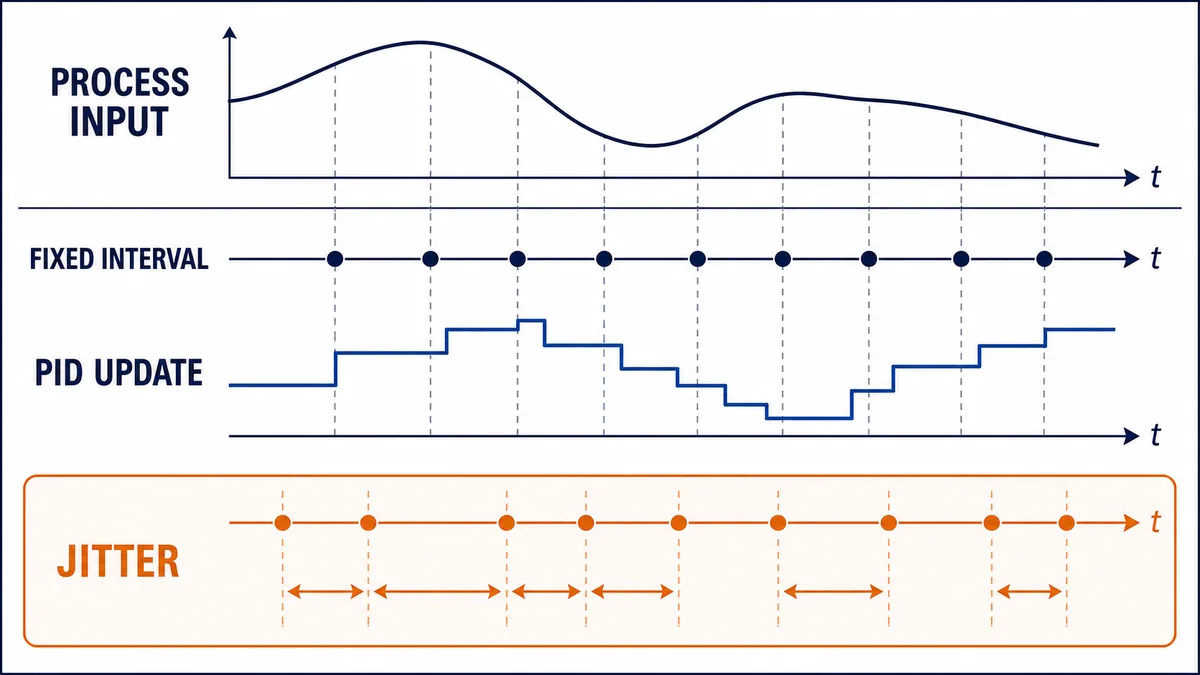
A discrete controller's integral and derivative actions depend on elapsed time. Call the vendor instruction from its documented periodic/task mechanism at the configured interval, or pass the correctly measured interval when the instruction explicitly supports it. Do not call it conditionally from irregular event logic while assuming 100 ms. Record scheduled interval, actual interval distribution, maximum jitter, task priority, execution time, overrun behavior and input/output update relationship.
For the teaching model, dt = 0.100 s. A one-second integral interval contains ten evaluations. If the same numeric Ki is used in a loop that actually runs at 1.0 s without the instruction compensating for elapsed time, integral action can change by a factor of ten. Some vendor blocks expect integral time rather than gain; some incorporate time internally. Exact instruction documentation controls conversion.
Work one PI calculation with explicit units
Flow loops commonly use PI rather than derivative when measurement noise and fast process response make D unhelpful, but that is an engineering decision. This arithmetic example uses an independent discrete PI form:
RawMV = Bias + Kp × Error + IntegralState
IntegralState_next = IntegralState + Ki × Error × dt
where Error = SP − PV. Illustrative units are:
SPandPV: L/min;Kp: percent output per (L/min);Ki: percent output per ((L/min)·second);dt: seconds;Bias, proportional contribution, integral state and output: percent.
Assume only for the arithmetic snapshot: SP = 300 L/min, PV = 250 L/min, Kp = 0.20 %/(L/min), prior integral state I = 2.00%, Ki = 0.020 %/((L/min)·s), dt = 0.100 s and Bias = 40.00%.
| Calculation | Expression | Result |
|---|---|---|
| error | 300 − 250 |
50 L/min |
| proportional | 0.20 × 50 |
10.00% |
| integral increment | 0.020 × 50 × 0.100 |
0.10% |
| next integral state | 2.00 + 0.10 |
2.10% |
| raw requested output | 40.00 + 10.00 + 2.10 |
52.10% |
These numbers demonstrate dimensional arithmetic. They are not tuning recommendations for a pump. Real controller forms can use proportional band, integral time/repeats, dependent gains, derivative on PV, filters, normalization or percent-scaled process variables. Translate the exact equation and units.
Use a reviewable behavior oracle—not fictional portable PID syntax
The downloadable pump flow PI behavior oracle defines a transparent teaching algorithm with conditional integration and manual tracking. It intentionally does not pretend that a generic IEC PID function block exists across vendors. Adapt the behavior to the selected Siemens, Rockwell, Schneider, Mitsubishi, Omron, CODESYS or other documented instruction rather than copying the file into production.
IF manual or unavailable:
    RequestedMV := bounded ManualMV or declared unavailable value
    IntegralState := AppliedMV - Bias - proportional contribution
ELSE:
    TrialIntegral := IntegralState + Ki * Error * dt
    TrialMV := Bias + Kp * Error + TrialIntegral
    Integrate when output is not saturated,
      or when error would drive the request back out of saturation
    RequestedMV := bounded(Bias + Kp * Error + IntegralState)
END_IF

AppliedMV := final arbitration of availability, run state, ramp and operating limits
Track AppliedMV back into the controller through the vendor's documented mechanism
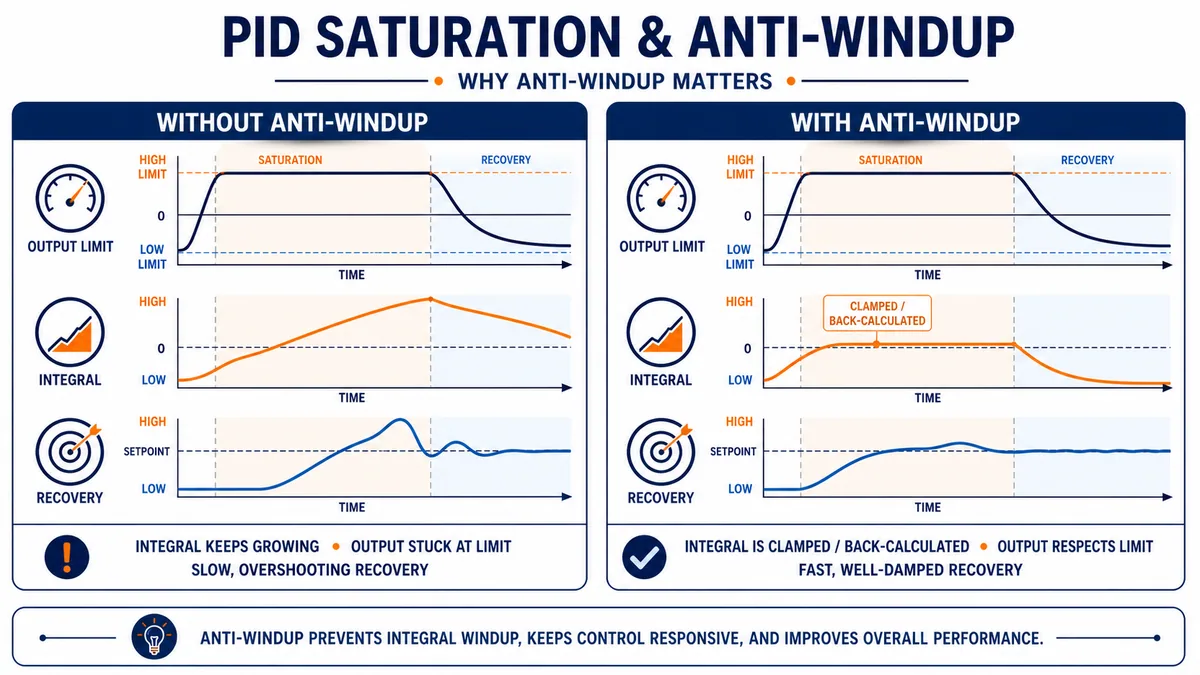
Conditional integration is one teaching anti-windup method. Vendor blocks may use clamping, back-calculation, tracking or other mechanisms. Use the documented feature. Clamping only the value after a PID block does not automatically prevent its internal integrator from continuing to accumulate.
Separate saturation, anti-windup and applied output
Suppose the controller requests 120%, the software limit is 100%, an operating limit caps speed at 80%, and the drive ramp presently applies 65%. Four different facts exist: raw demand 120%, controller-limited demand 100%, arbitrated request 80% and applied reference 65%. If the PID tracks only its own 100% output, it does not know that the final element receives 65%.
| Value/status | Meaning | Diagnostic use |
|---|---|---|
RawMV |
equation result before controller limit | exposes how strongly controller wants to act |
LimitedMV |
result after configured PID output bounds | identifies controller saturation |
RequestedMV |
value after mode/availability/operating arbitration | identifies external constraint |
AppliedMV |
value actually sent/accepted after ramp/interface | identifies final-element difference |
| high/low saturation | controller request at bound | separates insufficient authority from poor tuning |
| tracking active | controller state follows applied/manual value | supports bumpless transfer and external limit handling |
Make manual-to-auto transfer bumpless
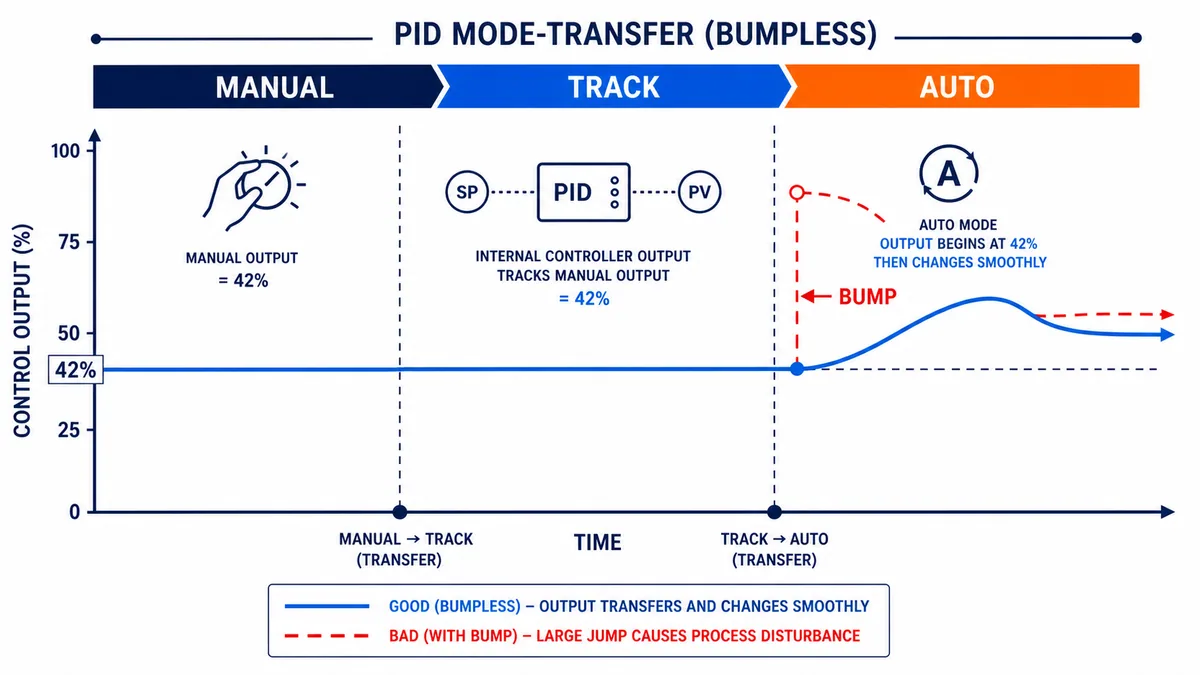
When manual output holds the pump at 58% and automatic control internally predicts 35%, switching without tracking can create a 23-point step. A bumpless strategy keeps controller state aligned with the applied output in manual or tracking mode, then transfers only when the measurement, setpoint, output and mode prerequisites are valid. Some designs initialize setpoint to PV; others keep an operator setpoint but preposition controller state. Follow the process requirement and exact instruction.
Test manual→auto and auto→manual at low, mid and high outputs; during a setpoint difference; while saturated; after signal-quality recovery; after stop/start; and across controller restart if applicable. “Bumpless” does not necessarily mean mathematically zero change—define an allowed magnitude and rate and measure it.
Run the loop against a bounded pump-flow model
For a reproducible software exercise, use the deliberately simple first-order model:
PV_next = PV + dt/τ × ((K × AppliedMV) − Disturbance − PV)
with dt = 0.1 s, τ = 2.0 s, K = 5 (L/min)/% and an output range 0–100%. At steady state with zero disturbance, 60% applied output gives 300 L/min. A declared 50 L/min load disturbance requires about 70% to return to 300 L/min in this linear model. This is an educational plant, not a pump-selection or hydraulic model: it omits static head, system curve, minimum flow, efficiency, cavitation, drive ramp, sensor lag, noise and nonlinear constraints.
Use the model to compare algorithm behavior under identical conditions:
| Scenario | Controlled input | Evidence to retain | Question answered |
|---|---|---|---|
| baseline | SP 0→300 L/min, zero disturbance | SP, PV, raw/limited/applied MV, P/I, mode/saturation | does the declared model track stably? |
| disturbance | add 50 L/min equivalent load after settled | same plus disturbance time | does integral remove the new offset? |
| high SP | SP beyond model/output authority | saturation and integral state | does anti-windup prevent runaway stored demand? |
| manual transfer | hold 58%, switch to auto under defined SP/PV | requested/applied step and PV | is transfer within defined bump/rate? |
| bad PV | declare flow invalid/stale | mode/status and output behavior | does bad data avoid maximum unsafe correction? |
| external limit | controller wants 85%, operating cap applies 65% | raw, limited, requested, applied and tracking | does controller follow actual authority? |
Translate the oracle to a real PLC PID instruction
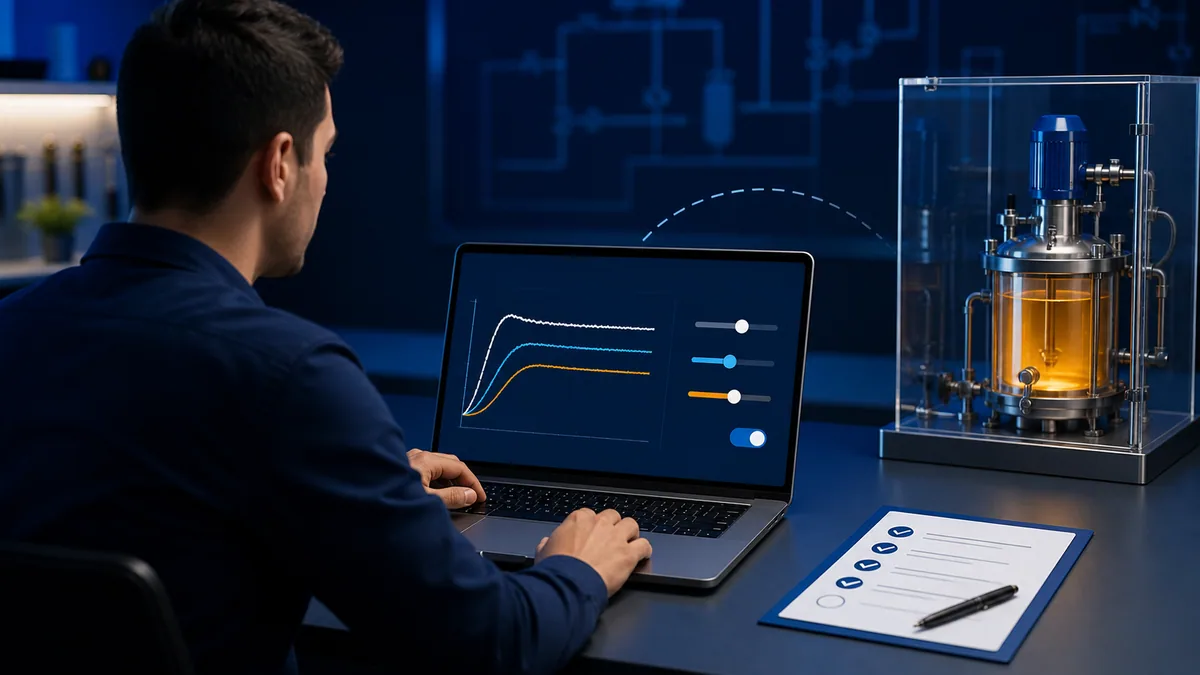
Do not match parameter names by appearance. Create a controller manifest:
| Manifest field | Record |
|---|---|
| target | controller order/revision, firmware, engineering software/build and license |
| instruction | exact PID/PI block, library/version, cyclic/task call method and instance storage |
| algorithm | parallel/dependent/standard form, P on error/PV, D on error/PV, filtering |
| units | SP/PV scale, output scale, gain or proportional-band units, integral/derivative units |
| timing | configured interval, actual task interval/jitter, input/output update and overrun behavior |
| direction | verified effect of increasing applied output on valid PV and exact action setting |
| modes | auto/manual/tracking ownership, initialization, restart and bumpless behavior |
| limits | PID bounds, external operating limits, ramp, rate and applied feedback |
| quality | invalid/stale measurement behavior and re-entry policy |
| protection | permissives, interlocks, trip ownership and independent safety/process protection |
Siemens, Rockwell and Schneider documentation expose different function/instruction models, forms and parameters. For example, Rockwell documents anti-reset windup and bumpless manual/auto behavior for its PID instruction; Siemens documents technology-object and instruction-specific commissioning and timing; Schneider documents its own PID block interfaces. The downloaded oracle proves only its declared behavior.
Commission with an evidence ladder
Before closed-loop tuning, prove the measurement, actuator and process direction. Under an approved procedure and within safe bounds, compare a small controlled applied-output change with VFD reference, drive feedback, pump state and flow response. Confirm that the sensor is credible, the flow path is established and the loop has useful authority in the intended operating region.
- verify P&ID/control narrative, pump/system limits, independent protection and authorization;
- verify transmitter range, calibration status, raw counts, engineering scaling, quality and time;
- verify VFD command/reference/feedback scale, minimum/maximum/ramp and start/stop ownership;
- verify an applied-output step changes flow in the predicted direction and record the response;
- verify fixed loop execution timing and instruction form/units;
- prove manual, tracking, unavailable and restart behavior;
- begin with approved conservative loop settings or a validated tuning method;
- test setpoint response, disturbance response, saturation, quality loss and transfer;
- review actuator movement, pressure, pump operating constraints and interaction with other loops;
- save as-left configuration, traces, exceptions, rollback and ownership.
Changing gains before scaling, direction, timing and applied-output evidence are correct can make a non-tuning fault worse.
Acceptance test matrix
Download the pump PID acceptance matrix. The generic matrix must be replaced by approved operating limits and test methods before use on equipment.
| Test | Expected result |
|---|---|
| 4, 8, 12, 16, 20 mA or documented raw equivalents | 0, 125, 250, 375, 500 L/min within declared tolerance; quality correct |
| underrange/overrange/wire break/stale | invalid status visible; automatic mode follows declared unavailable policy |
| output scale | requested/applied percentages match drive reference and feedback within declared tolerance |
| action direction | small approved applied increase changes flow in predicted direction |
| task interval | configured and measured execution meet 100 ms example or project requirement |
| manual limits | operator request cannot exceed approved min/max/ramp/authorization |
| manual→auto | applied-output bump/rate remains within declared acceptance limit |
| auto→manual | manual starts at/tracks applied value per requirement |
| low/high saturation | status visible; integral state does not prolong recovery unacceptably |
| external limit | controller tracks applied value rather than hidden higher request |
| setpoint step | rise, overshoot, settling, offset and output movement meet requirements |
| load disturbance | recovery and output movement meet requirement without sustained saturation |
| stop/start | output, integral, setpoint and mode initialize/retain exactly as declared |
| VFD unavailable/trip | loop leaves automatic authority and reports first cause; no uncontrolled restart |
| communication/HMI loss | PLC/local loop follows declared autonomous behavior; no expired request replay |
| backup/restore | released loop configuration and parameters restore with evidence |
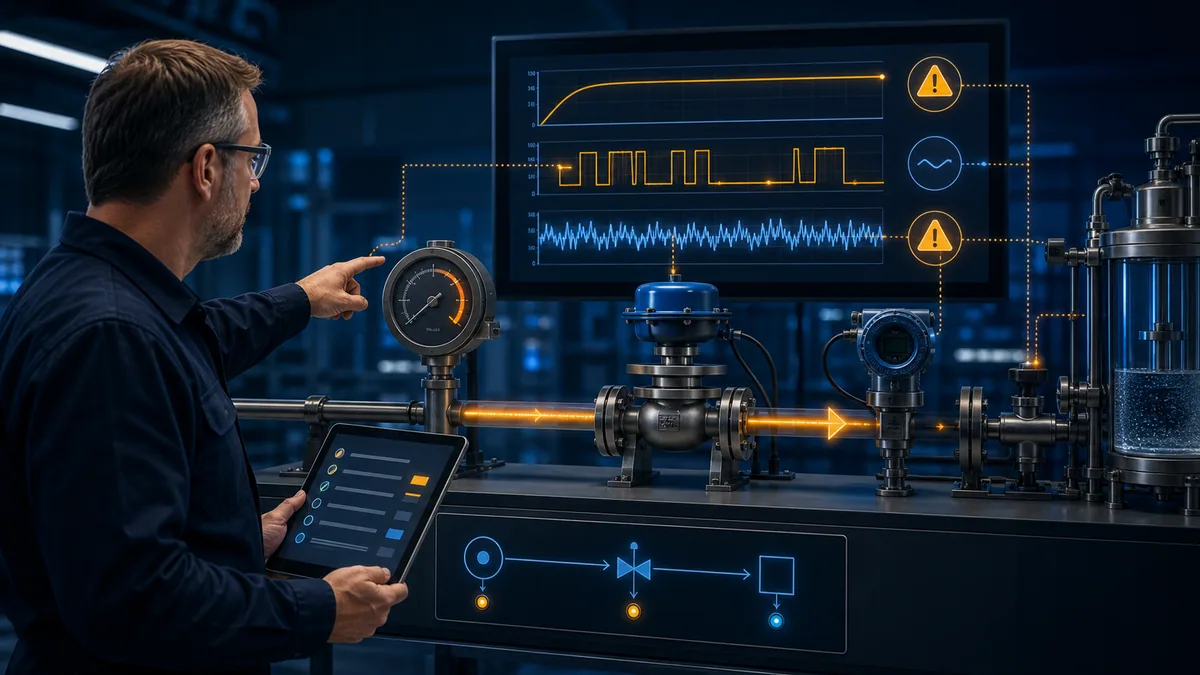
Diagnose the loop before retuning it
| Symptom | First evidence | Common non-tuning causes |
|---|---|---|
| output moves the wrong way | applied-output step versus PV direction | wrong action, inverted scaling, valve/path effect |
| PV fixed at zero/max | raw/status/quality and field measurement | wire break, range mismatch, scaling/clamp hides fault |
| raw MV differs from applied | controller limit, operating cap, ramp, VFD reference/feedback | external arbitration or unavailable actuator |
| slow response at 100% | pump/system curve, valve path, pressure, drive speed/current and PV validity | insufficient authority, restriction, wrong range, pump issue |
| cycling despite modest gains | task timing, sensor noise, drive ramp, valve/check-valve, interaction | variable call, quantization, stiction or another loop |
| large bump into auto | applied tracking, internal state, SP/PV and mode sequence | no tracking or wrong vendor manual-mode setting |
| slow recovery from saturation | raw MV/integral/tracking versus applied | windup or hidden external limit |
| good simulation, poor plant response | model versus measured gain/time/dead time/nonlinearity | invalid model or operating-region change |
| intermittent instability | task jitter, communication age, process disturbance, VFD/load logs | timing/data loss or changing process—not gains alone |
AI and search answer map
| Question | Direct answer | Boundary |
|---|---|---|
| What is a pump PID flow-control example? | A closed loop in which measured flow drives a bounded VFD speed correction toward a setpoint. | exact pump/system and controller must be identified |
| How do I scale 4–20 mA to 0–500 L/min? | (mA−4)/16×500; 12 mA equals 250 L/min. |
real module raw counts/diagnostics come from its manual |
| Should a flow loop use PI or PID? | Many use PI, but derivative is an engineering choice based on process and measurement. | no universal rule or gain exists |
| Does output clamping stop PID windup? | Not necessarily; internal integral state needs documented anti-windup/tracking. | verify exact instruction behavior |
| How do I switch a pump PID from manual to auto? | Track controller state to applied output and transfer only under valid conditions. | define measurable bump/rate acceptance |
| How fast should a PID task run? | Fast enough for dynamics with stable measured timing; this model uses 100 ms only as an example. | instruction and process evidence control interval |
| Why is flow low at 100% output? | The loop lacks authority or the measurement/path/pump/drive has a fault. | diagnose before increasing gains |
| Can simulator gains be copied to a real pump? | No; model dynamics, units and controller forms can differ. | identify and commission the actual loop safely |
Frequently asked questions
What is a pump PID flow-control loop?
It is a feedback loop in which a flow transmitter provides the process variable, an operator/sequence provides a setpoint, a PI/PID controller calculates a bounded request, and a VFD changes pump speed. The measured flow returns to close the loop. Local availability and protection remain separate.
How do I scale 4–20 mA to 0–500 L/min?
When the value is truly in milliamps, use (mA−4)/(20−4)×500. Thus 4, 8, 12, 16 and 20 mA represent 0, 125, 250, 375 and 500 L/min. A PLC module normally provides product-specific raw counts and diagnostics, so use its exact manual.
Is 12 mA equal to half scale?
Yes for an ideal linear 4–20 mA range: 12 mA is halfway between 4 and 20 mA, so it represents 250 L/min on a 0–500 L/min span. Real uncertainty, calibration and module/transmitter diagnostics still apply.
Should pump flow control use PI or PID?
PI is common because integral removes offset and derivative can react to noisy flow measurement, but “common” is not a design decision. Evaluate process dynamics, measurement quality, disturbance objective, controller filtering and output movement. If D is used, verify whether it acts on error or PV and its units.
What are good PID gains for a centrifugal pump?
No universal gains are safe or technically meaningful. Gains depend on controller form/units, interval, scaling, pump/system response, operating point, VFD ramp, transmitter dynamics and constraints. Use an approved identification/tuning method and controlled commissioning evidence.
Does clamping the VFD output prevent integral windup?
Not automatically. An external clamp can limit the applied value while the PID block's internal integrator continues accumulating. Use the exact controller's anti-windup and applied-output tracking mechanisms and test recovery from both controller and external saturation.
What is bumpless transfer in pump PID control?
It means mode transfer keeps the applied speed-reference change within a declared acceptable magnitude/rate. The controller typically tracks applied manual output before entering automatic. Test at multiple outputs, errors, limits, restarts and quality-recovery states.
Should the pump run whenever the flow setpoint is above zero?
Not by that condition alone. Start/stop requires an approved control narrative covering flow path, pump availability, drive readiness, permissives, minimum operating requirements, trips, restart and independent protection. A setpoint is not proof that the equipment may run.
How often should the PID instruction execute?
Choose a stable interval appropriate to the measured process dynamics and instruction requirements. This teaching model uses 100 ms, not a universal recommendation. Record configured and measured interval, jitter, priority, execution time, input/output timing and overrun behavior.
Why does increasing PID output reduce measured flow?
That contradicts the assumed action for a normal speed-controlled pump in the defined path. Verify actual applied reference, drive direction/speed, valve/check-valve state, sensor orientation/scaling and process configuration. Prove direction with an approved bounded step before selecting the action setting.
Why is flow below setpoint when PID output is 100%?
The loop may lack authority, or the measurement, speed reference, drive/pump, valve/path, pressure/static head or operating constraint may be wrong. More integral gain cannot create unavailable capacity. Compare raw, limited and applied output with drive feedback and process evidence.
Can I use a generic IEC PID function block in any PLC?
No universal cross-vendor PID call can be assumed. IEC 61131-3 standardizes languages, not one identical PID instruction. Vendors differ in block names, equations, gain units, timing, modes, tracking and limits. Translate the behavior through the exact manual.
Can I copy gains from a pump PID simulator to a PLC?
No. Simulator gains belong to its stated model, interval, equation and scale. Use simulation to learn behavior and pretest an evidence plan. Identify the actual process and translate the exact controller form/units before controlled commissioning.
What should I trend when commissioning pump flow PID?
Trend synchronized SP, PV, PV quality/age, raw/limited/requested/applied output, P/I/D contributions if available, mode/tracking/saturation, VFD command/reference/feedback, drive state, important pressure/valve states and disturbances. Preserve sample/query semantics and configuration version.
Practical next step
Run the downloadable behavior oracle against the stated first-order model and complete every acceptance case with predicted results first. Then create the exact target-controller manifest—do not translate gains until equation, units and timing are proven. You can change setpoint, disturbance and loop terms in the browser PID lab, operated by the same owner as PLC Programming IO. It does not validate a PLC instruction, pump/system curve, transmitter, VFD, I/O, process, machine or safety function.
Sources, review scope, and limitations
This example was reviewed on 31 August 2026. Product versions and documentation change. Use the current manual for the exact target and approved process requirements.
- ISA — ISA-TR5.9-2023 overview of PID algorithms, forms and units
- ISA — PID equation optimization and discrete integral example
- IEC — IEC 61131-3:2025 programmable-controller languages
- Siemens — SIMATIC S7-1200/S7-1500 PID Control function manual, November 2025
- Rockwell Automation — Logix PID configuration and equation choices
- Rockwell Automation — PID anti-reset windup and bumpless manual/auto transfer
- Rockwell Automation — PIDE algorithm reference
- Schneider Electric — Machine Expert PID function block
- Schneider Electric — FB_PID function block
- MathWorks — anti-windup control with PID Controller block
- MathWorks — PID Tuner reference and controller forms
- National Instruments — control-system fundamentals: PID
- National Instruments — PID Control Toolkit user manual
- University of Michigan — introduction to PID controller design
- U.S. Department of Energy — Improving Pumping System Performance sourcebook
- Hydraulic Institute — pump-system resources
- NIST — SP 800-82 Rev. 3, Guide to Operational Technology Security
- OSHA — Control of hazardous energy, 29 CFR 1910.147
- OSHA — Electrical safety-related work practices, 29 CFR 1910.333
The seven figures are original editorial illustrations produced in-house for the PID topic family. They are not PLC/VFD screenshots, pump curves, P&IDs, wiring diagrams, timing guarantees or safety designs. The arithmetic, behavior oracle, first-order model and test cases are original teaching material; they are not a validated plant model, tuning prescription or operating procedure.
This page does not authorize connecting, energizing, starting, forcing, bypassing, tuning or testing installed equipment. Qualified and authorized personnel must apply the site hazard assessment, hazardous-energy and electrical safe-work rules, exact equipment manuals, validated pump/process limits, independent protection, cybersecurity, management of change and approved commissioning and recovery procedures.
PLC Programming IO Editorial Team
Industrial automation education, references, and software testing
The PLC Programming IO Editorial Team publishes sourced industrial-automation education and documents how material is reviewed, tested, and corrected. A team byline means the publisher is responsible for the page; it does not represent a fictional person or imply an engineering licence.
Coverage:
- • PLC programming concepts and examples
- • Vendor software tutorials and comparisons
- • SCADA, HMI, protocols, and instrumentation
- • Training, careers, and reference material
Review standard:
- • Prefer primary and official sources
- • Record software versions when material
- • Separate tested facts from estimates
- • Publish material corrections
Important scope note
This site provides education, not project-specific engineering approval. Safety, code, and compliance decisions require a qualified person with access to the actual machine and jurisdiction.